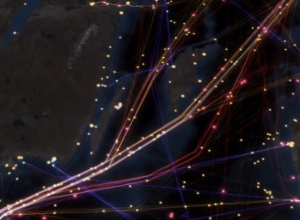
Digital artist Lauri Vanhala animated a day of maritime traffic in the Baltic…
Maps
Intuitive to look at spatial patterns and great for distributing geographic data.
-
Maritime traffic in the Baltic Sea, animated
-
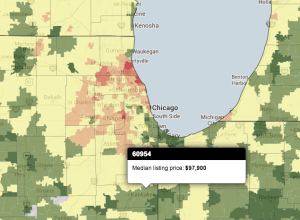
Map of median home listing prices
In their continued efforts to help potential home buyers find out all they…
-
Real-time media consumption
Last year, URL shortening service bitly and Forbes made a map that showed…
-
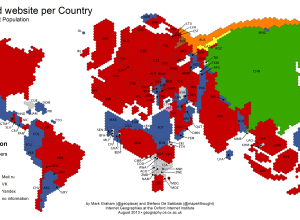
Most visited site by country
Mark Graham and Stefano De Sabbata for Information Geographies mapped the most visited…
-
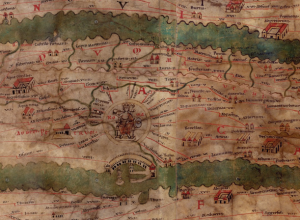
Greco-Roman mapmaking
Measuring and Mapping Space: Geographic Knowledge in Greco-Roman Antiquity opens at Institute for…
-
Cities pulse via Foursquare check-ins
Foursquare check-ins can be self-encapsulated and personal to the individual, where each dot…
-
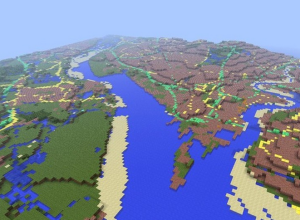
Great Britain recreated in Minecraft
The Ordnance Survey, the national mapping agency for Great Britain, mapped 220,000 square…
-
Searching for other Earths
In a step-by-step narrative, produced by Adam Becker, MacGregor Campbell and Peter Aldhous…
-
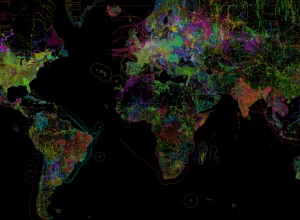
OpenStreetMap, the work of individuals visualized
In the continued series of meta-data-driven maps, OpenStreetMap shows the work of individuals…
-
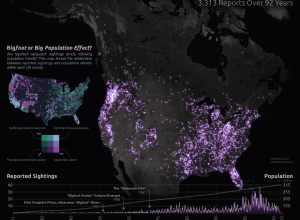
Sasquatch sightings
Josh Stevens, a PhD candidate at Penn State, mapped 92 years of sasquatch…
-
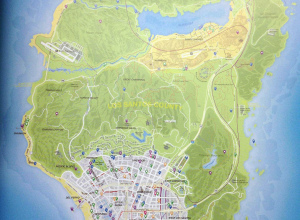
Game map from Grand Theft Auto 5
With just five days left until Grand Theft Auto 5 is out, a…
-
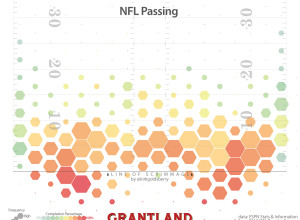
Where NFL quarterbacks throw
Kirk Goldsberry, known for his basketball analysis and shot charts, has applied his…
-
Age of city buildings
When we think about the age of cities, it’s common to think of…
-
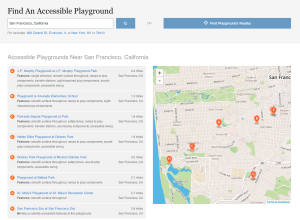
Playgrounds for everyone →
NPR digs into accessible playgrounds, because everyone should get to play.
Remember running… -
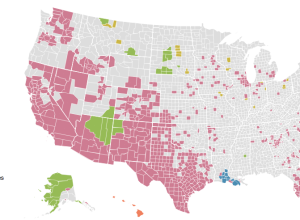
Where non-English language is spoken in the US →
Dan Keating and Darla Cameron for the Washington Post mapped commonly used languages…
-
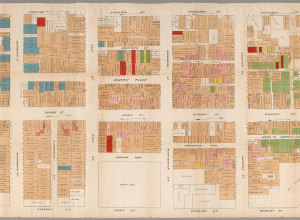
Map shows illegal activity in San Francisco Chinatown, from 1885
From the David Rumsey map collection, the detailed map of San Francisco Chinatown…
-
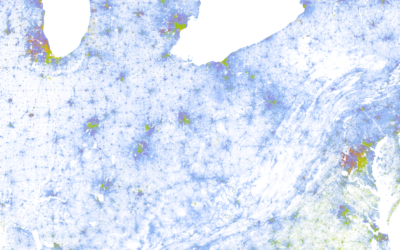
Racial dot map
Dustin Cable, a demographer at the University of Virginia’s Weldon Cooper Center for…
-
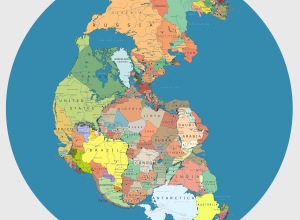
Pangea with political boundaries
What would Pangea look like if today’s political boundaries were drawn on it?…




 Visualize This: The FlowingData Guide to Design, Visualization, and Statistics (2nd Edition)


