Maybe you saw the Wal-Mart growth map I made a while back. NPR…
Maps
Intuitive to look at spatial patterns and great for distributing geographic data.
-
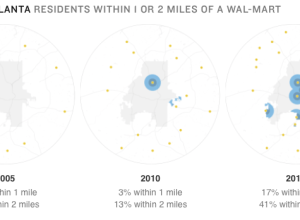
Growth of urban neighborhood Wal-Mart
-
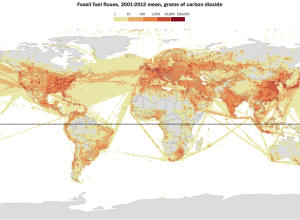
Map of global carbon emissions
Using data from the Earth System Research Laboratory of the National Oceanic and…
-

Pac-Man Google Maps
You can currently play Pac-Man on Google Maps. Just go to some location…
-
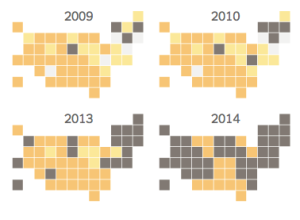
Gay marriage legalized by state
Changes in gay marriage rights had changed slowly over the years, but more…
-
Minimal landscape maps
Designer Michael Pecirno experiments with single-subject maps in his project Minimal Maps. No…
-
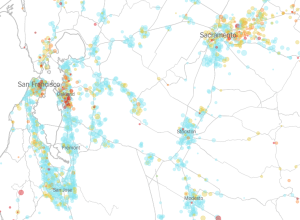
Making better social media maps
Location-based data from social media can be interesting to analyze and map, but…
-

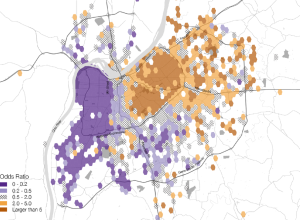
Out-of-state commuters mapped
In a straightforward map, Seth Kadish shows the percentage of county residents who…
-
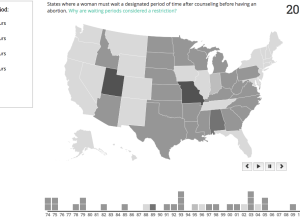
Abortion policies, over time and by state
For a class project, Katie Kowalsky, Dylan Moriarty, and Robin Tolochko examined changes…
-
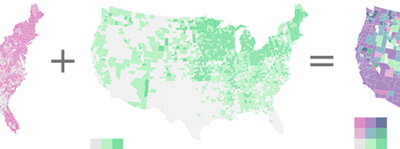
Bivariate choropleth how-to
Your standard choropleth map shows geographic areas colored by a single variable. You’re…
-
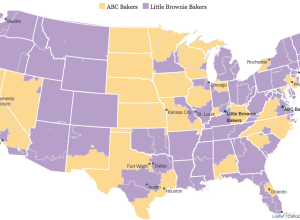
Girl Scout cookies differ by region
The Girl Scouts, known for their annual cookie sales, uses two bakers. These…
-
Probably not a heat map
A heat map is a grid of numbers colored by value. I wrote…
-
Vaccination rates for every kindergarten in California →
The New York Times mapped the vaccination rate for every kindergarten in California.…
-
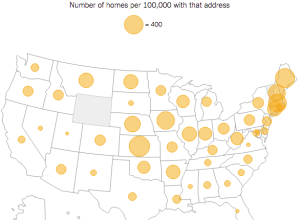
Your street name across the country
Here’s a fun searchable map from the New York Times. Enter a street’s…
-
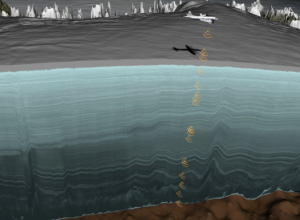
Mapping ice layers with radar data
I don’t know exactly how much data NASA has in the bank, but…
-
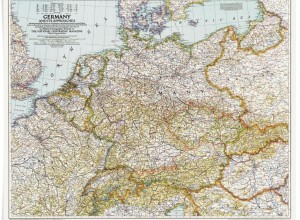
A century of National Geographic maps
Celebrating the 100th year of the National Geographic cartographic department, they provide a…
-
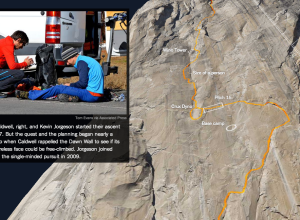
3-D model to show free-climb route
Tommy Caldwell and Kevin Jorgeson are free-climbing almost 3,000 feet up El Capitan,…
-
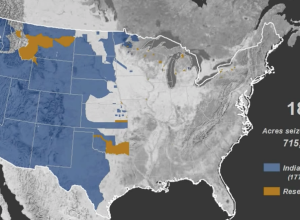
Mapped history of how Native American land was taken
In Invasion of America, an animated map shows the loss of land.…
-
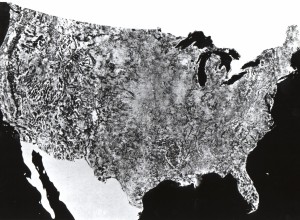
The first photo of the United States by NASA satellite
In 1974, NASA published their first satellite photo of the contiguous United States…
Recently for Members
Second Edition
 Visualize This: The FlowingData Guide to Design, Visualization, and Statistics (2nd Edition)
 Visualize This: The FlowingData Guide to Design, Visualization, and Statistics (2nd Edition)
New tools, refined process.
Browse by Chart Type See All →


