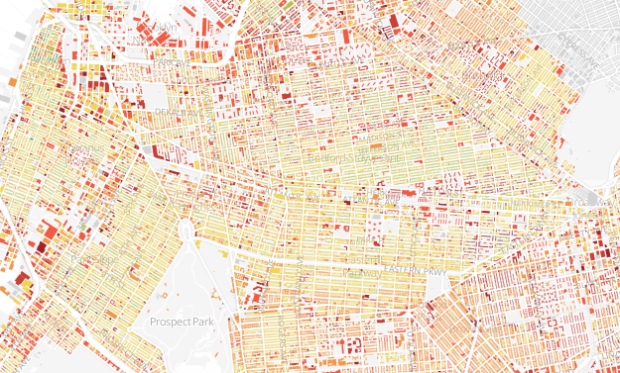
When we think about the age of cities, it’s common to think of when it was founded or established. However, the growth of a city is often more organic, as buildings and homes spring up at different times and different areas. So when you map buildings by when they were built, you get a sense of that growth process. Thomas Rhiel did this for Brooklyn.
The borough’s a patchwork of the old and new, but traces of its history aren’t spread evenly. There are 320,000-odd buildings in Brooklyn, and I’ve plotted and shaded each of them according to its year of construction. The result is a snapshot of Brooklyn’s evolution, revealing how development has rippled across certain neighborhoods while leaving some pockets unchanged for decades, even centuries.
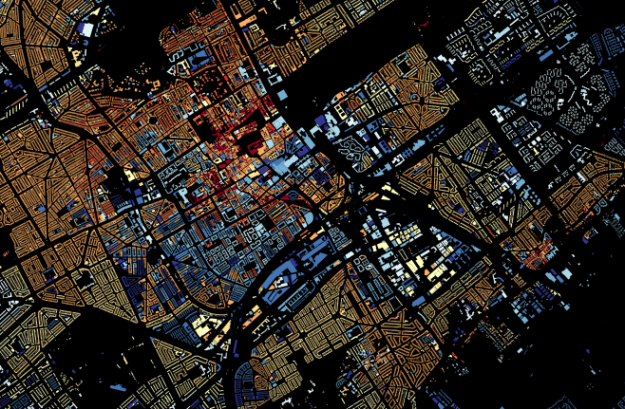
Inspired by Rhiel’s map, one of almost ten million buildings in the Netherlands:
Now waiting for someone to do this for many more cities.
 Visualize This: The FlowingData Guide to Design, Visualization, and Statistics (2nd Edition)