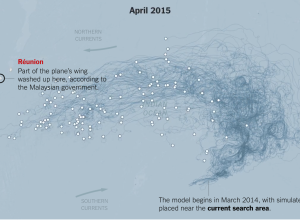
Malaysia Airlines Flight 370 went down a year ago, and with recently found…
Maps
Intuitive to look at spatial patterns and great for distributing geographic data.
-
Possible float routes for Malaysia Airlines Flight 370
-
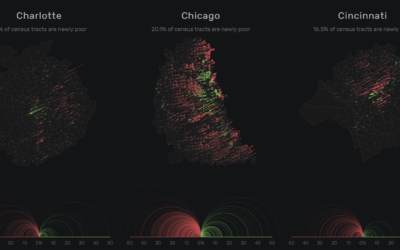
Exploding nation of poverty
Poverty is on the rise. Justin Palmer mapped it for major cities in…
-
United States electricity map
The Washington Post mapped power plants in the United States by type and…
-
Million dollar blocks and the cost of incarceration
Incarceration costs a lot of money. We know this, sort of. But how…
-
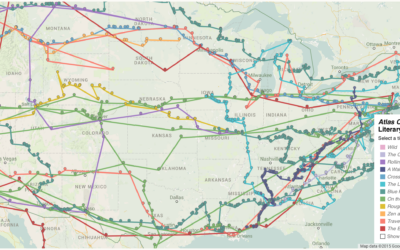
Map of literary road trips
Ever wanted to follow in the footsteps of a famous writer or literary…
-
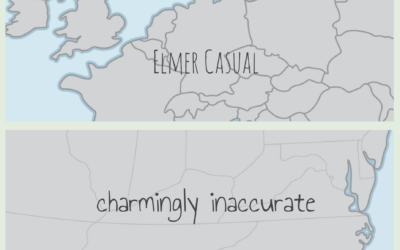
Hand-drawn map boundaries
You’ve probably seen those “maps” where people from other countries draw the United…
-
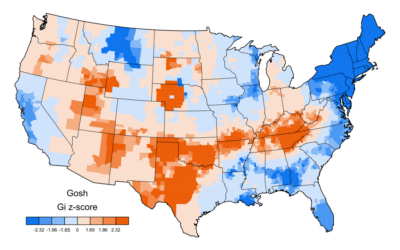
Swear maps
Linguist Jack Grieve posted a bunch of maps that show swearing geographically, based…
-
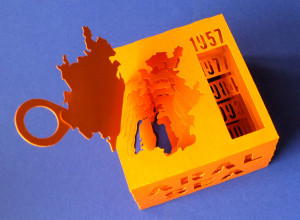
3-D paper model of a shrinking sea
The Aral Sea in Uzbekistan, formerly one of the largest lakes in the…
-
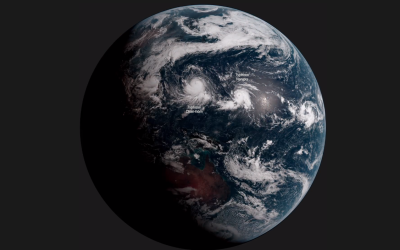
Earth time-lapse from 22,000 miles out
Japan has a new weather satellite in stationary orbit, Himawari-8, that takes a…
-
Map of just the time zones
Kind of fun. Branden Rishel mapped just the time zones. No borders or…
-
Link
How we created an interactive map of Europe with 100k+ areas →
A lot of boundary areas, but still loads quickly.
-
Make a map poster of anywhere
Map posters are easy to come by for major cities. But if you…
-
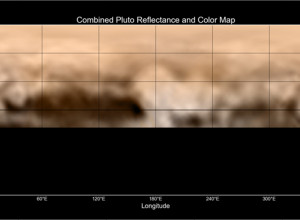
Pluto reflectance map: Whale and the Donut
Using images taken by New Horizons between June 27 and July 3, this…
-
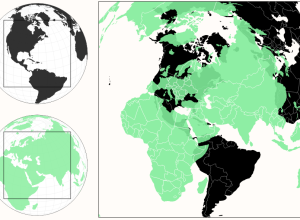
A more realistic perspective of country sizes
Most of us have seen the True Size of Africa graphic that squishes…
-
Don’t let the maps fool you
Maps are fun to look at and get easier to make every day,…
-
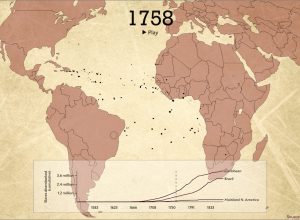
Animated map shows Trans-Atlantic slave trade
The Trans-Atlantic Slave Trade Database provides records for thousands of voyages between the…
-
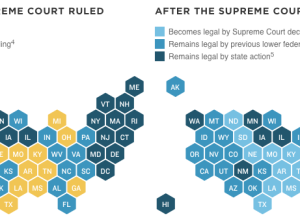
Same-sex marriage legalized in all states
The Supreme Court legalized gay marriage today. NPR shows before and after the…
-
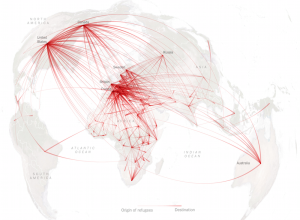
Refugee migration mapped globally
According to estimates recently released by the United Nations, about 14 million left…






 Visualize This: The FlowingData Guide to Design, Visualization, and Statistics (2nd Edition)


