When you’re a kid, a year seems like forever. Appending “and a half”…
Infographics
Telling stories with data and graphics.
-
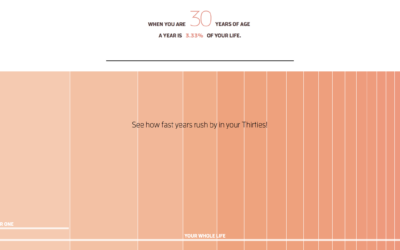
Why time flies when you’re older
-
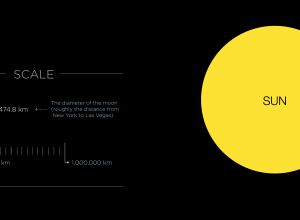
If the Moon were one pixel in size
Somehow these space-in-perspective graphics and interactives never get old. I guess the size…
-
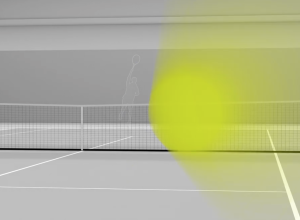
See a 150mph tennis serve to your face
Hawk-Eye is a collection of technologies that allows high-granularity sports tracking, most notably…
-
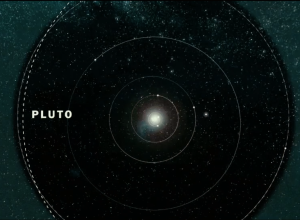
Journey to Pluto
The New Horizons spacecraft launched on January 19, 2006 and is set to…
-

U.S. women’s soccer gameplan
I know next to nothing about soccer. Like there’s nothing, and then I’m…
-
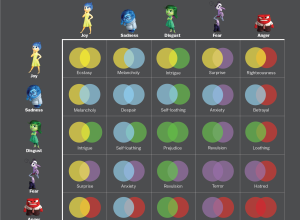
Combining Inside Out emotions for new ones
Spoiler alert for Inside Out. At the climax of the movie, we see…
-
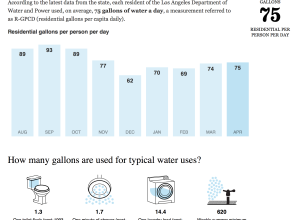
Drought report cards for California water districts
Thomas Suh Lauder for the Los Angeles Times provides you with a way…
-
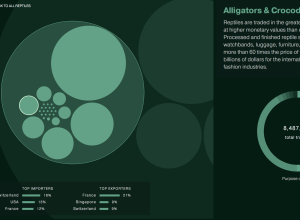
Traded animals
Based on data from the CITES Trade Database, “more than 27 million animals…
-
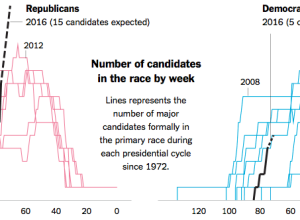
More presidential candidates please
“If it seems as if the list of presidential candidates for 2016 is…
-

Endangered species depicted with geometric pieces
In Pieces by designer Bryan James is an animated piece that uses simple…
-
Why the subway isn’t getting a move on already
You’re headed to the subway platform and you hear a train coming. The…
-
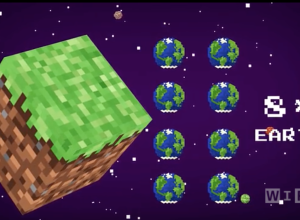
Size of Minecraft
I tried playing Minecraft a couple of times but quickly lost interest. Clearly…
-
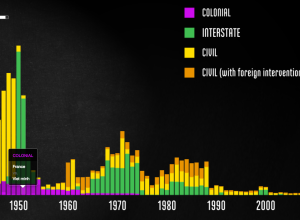
Interactive documentary connects World War II data to the events
Millions of peopled died during World War II, but it’s difficult to grasp…
-

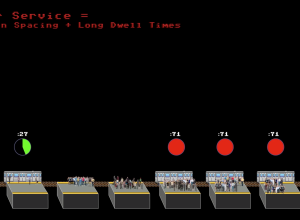
Why buses bunch at single stops
Maybe you’ve waited at a bus stop for longer than usual, and your…
-
Power of the reveal
Hannah Fairfield, who does graphics at the New York Times, talks about using…
-
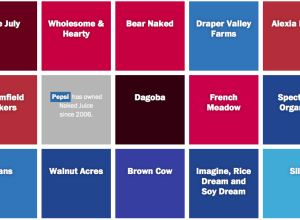
The big companies behind organic food brands
When you walk down the aisles of the grocery store, there are probably…
-
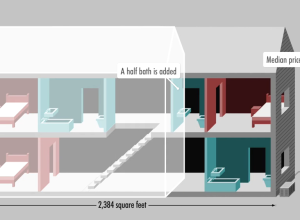
Median home in America, over 40 years
The median home in America has changed in a variety of ways. Square…
-
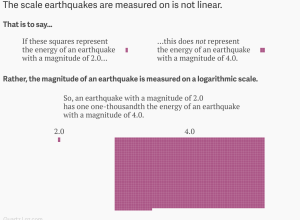
Earthquake magnitude and the logarithmic scale
The earthquake in Nepal was big, but there’s a discrepancy in just how…
Recently for Members
Second Edition
 Visualize This: The FlowingData Guide to Design, Visualization, and Statistics (2nd Edition)
 Visualize This: The FlowingData Guide to Design, Visualization, and Statistics (2nd Edition)
New tools, refined process.
Browse by Chart Type See All →


