The Tampa Bay Times takes you through a 3-D model of Pulse Nightclub…
Infographics
Telling stories with data and graphics.
-

What happened at Pulse in Orlando
-
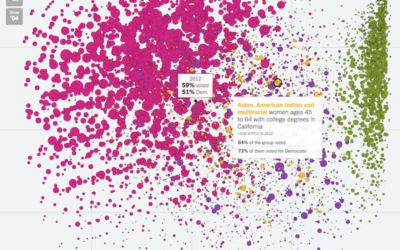
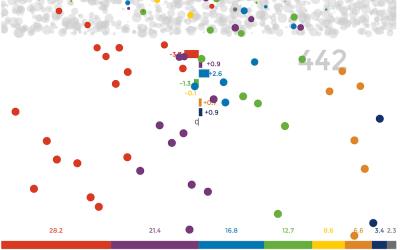
Voting habits for various demographic groups
Voter turnout and political leanings for various demographic groups play an important role…
-
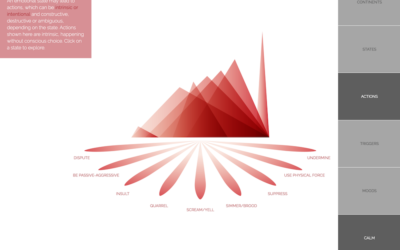
Atlas of Emotions, a collaboration with the Dalai Lama
Emotions are complex and only partially understood, yet such a force in how…
-
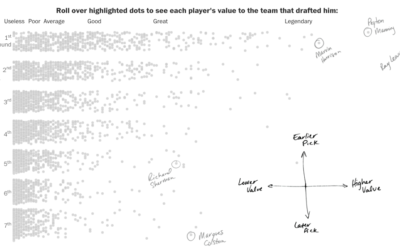
NFL draft pick quality for your team
Despite what commentators and sports analysts might have you think, picking great players…
-
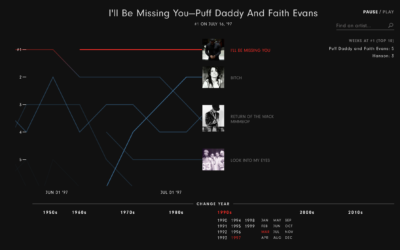
Music timeline plays through decades of top songs
The Year that Music Died from Polygraph is an animated timeline that shows…
-
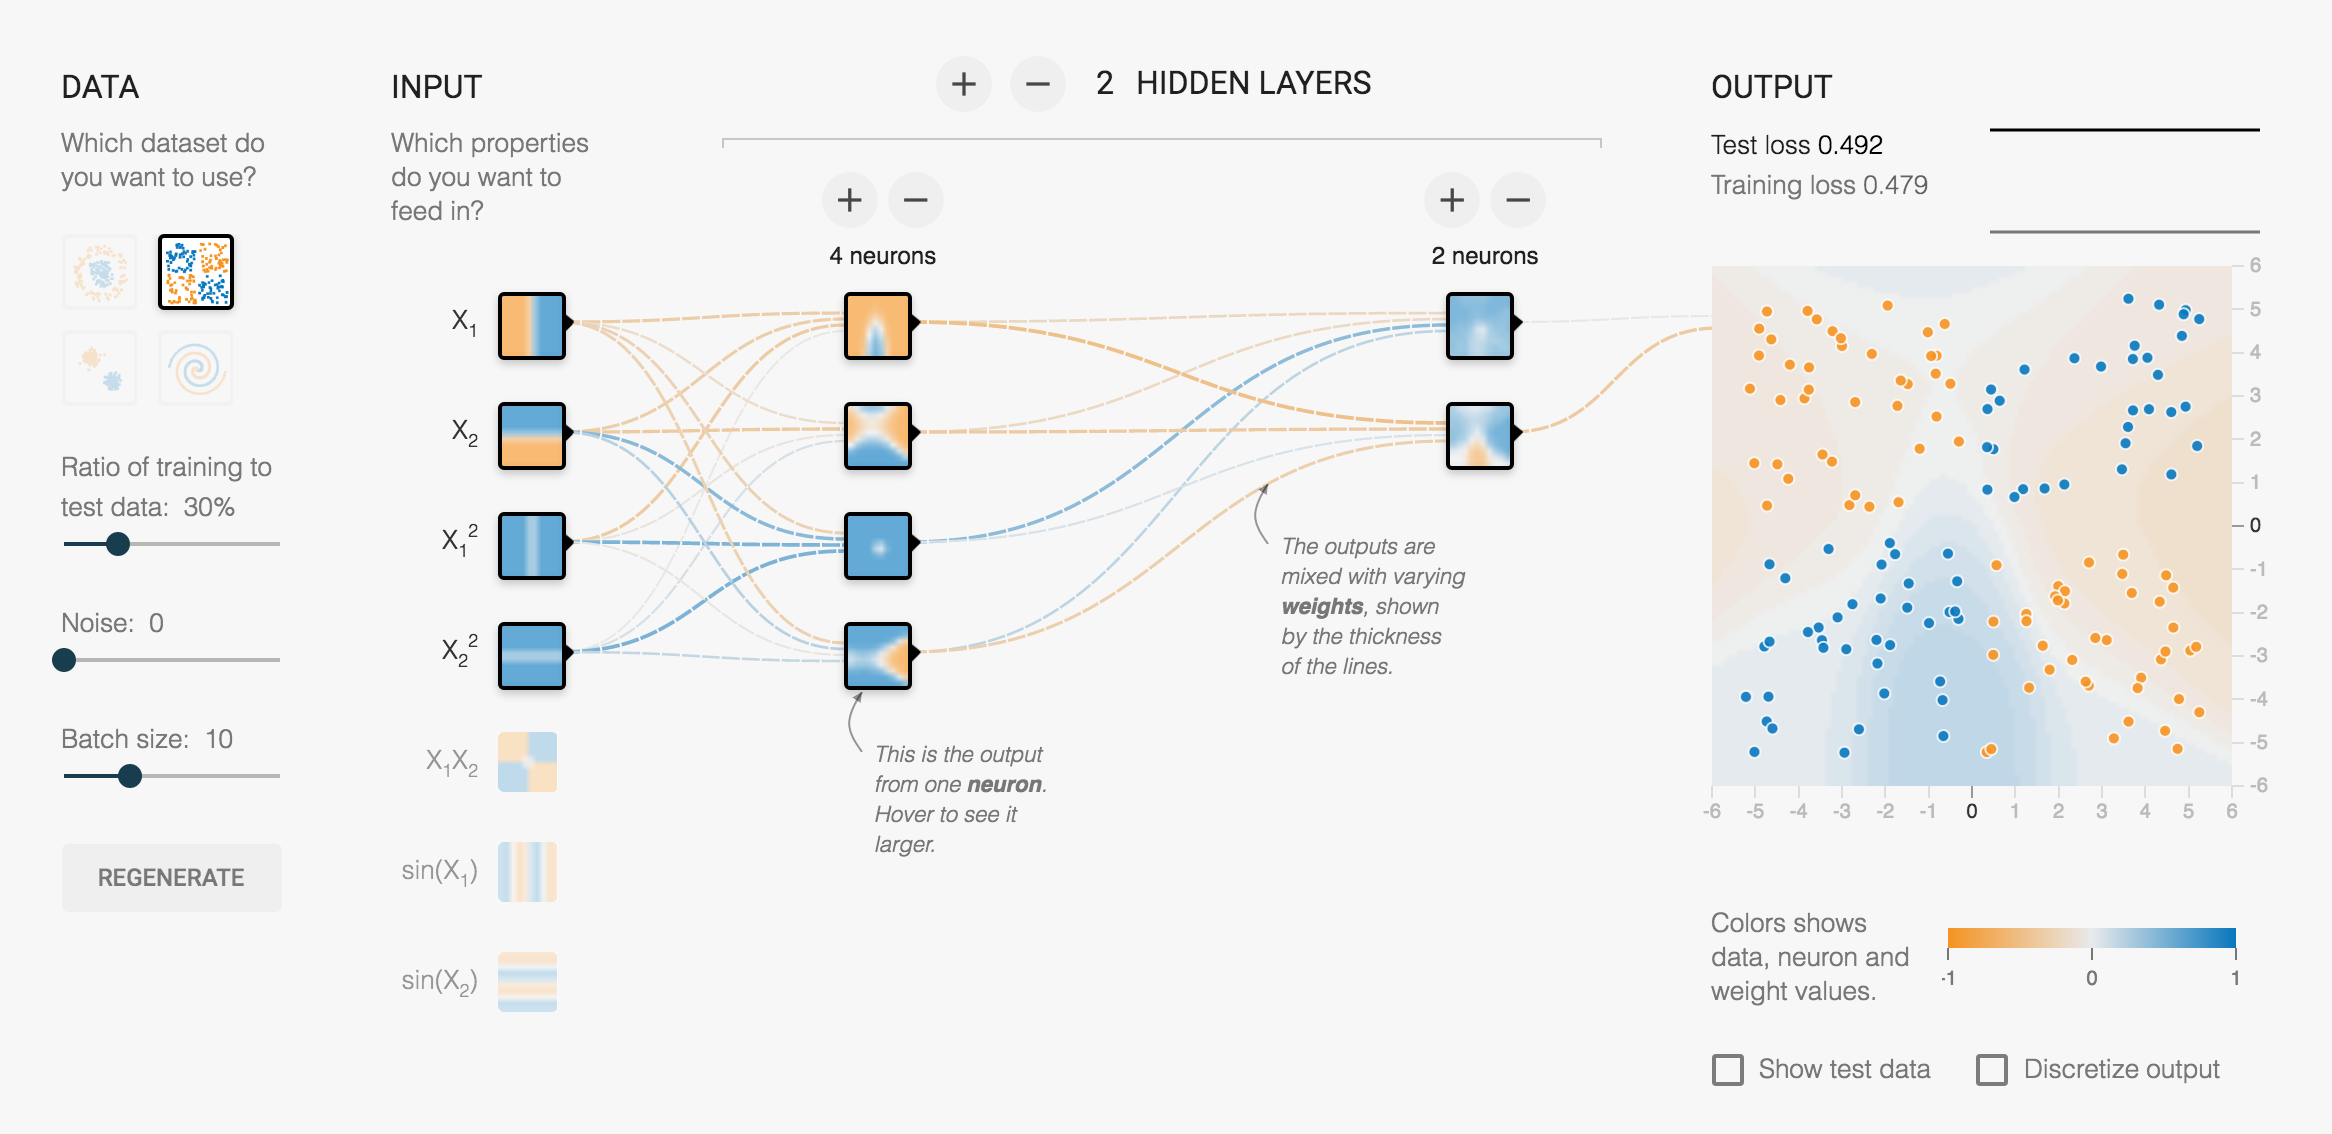
Here’s how a neural network works
Daniel Smilkov and Shan Carter at Google put together this interactive learner for…
-

Titanic sinking in real-time
Visualization of time is usually about compression so that you can see more…
-

Virus trading cards
Eleanor Lutz made some trading cards — for viruses.
To make the 3D… -

Balance the Trump and Cruz tax plans
The tax plans of Ted Cruz and Donald Trump might seem fine if…
-
Simulation shows why polls don’t always match future results
With election season in full swing, as far as the news is concerned…
-
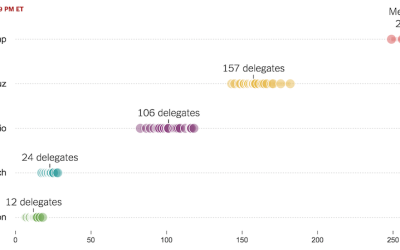
Super Tuesday simulation to show uncertainty
As we know, there are various outcomes during election season, with uncertainty in…
-
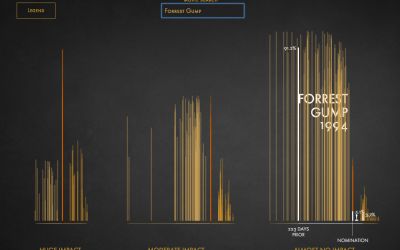
Impact of Best Picture Oscar nomination on profit
I think the general assumption is that getting an Oscar nomination for Best…
-
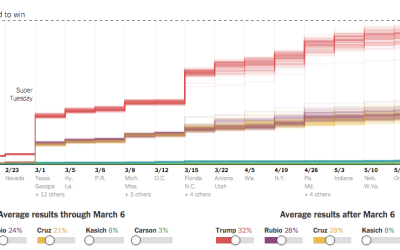
Possible paths for a Trump nomination loss or win
It pains me to imagine a time when Donald Drumpf earns a Republican…
-
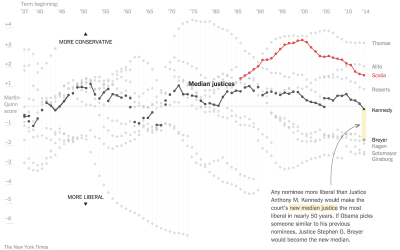
Supreme Court shifts in power
The Upshot has been doing a good bit on the Supreme Court dynamics…
-
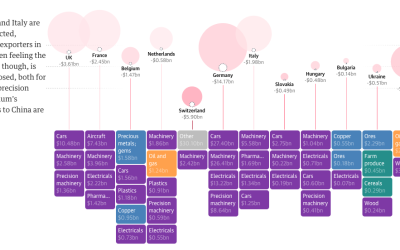
International impact of China’s economic slowdown
China’s economic slowdown means a major decline in imports from other countries, which…
-

Same source, different styles →
Jaakko Seppälä drew ten comic characters, each in its original style and in…
-
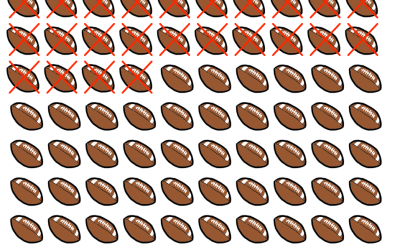
Counting your days left with emoji
While we’re on the topic of life expectancy, Tim Urban of Wait But…
-
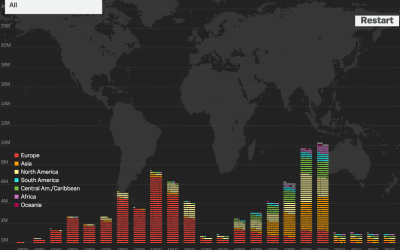
Immigration history
American immigration history is chock full of policies and restrictions, and you can…
Recently for Members
Second Edition
 Visualize This: The FlowingData Guide to Design, Visualization, and Statistics (2nd Edition)
 Visualize This: The FlowingData Guide to Design, Visualization, and Statistics (2nd Edition)
New tools, refined process.
Browse by Chart Type See All →


