Aaron Koblin, Creative Director of Google’s Data Arts team, shares some of the…
Data Art
Finding the beauty in numbers.
-

Aaron Koblin on visualizing humanity
-

Art reproduction incongruencies
When you think art reproduction, you probably think of something that looks almost…
-
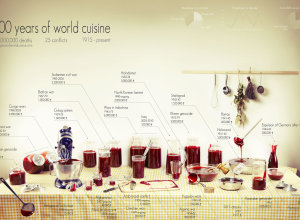
A century of deaths and a lot of fake blood
Rather than bars, bubbles, and dots, Clara Kayser-Bril, Nicolas Kayser-Bril, and Marion Kotlarski…
-
Where the water resources are and where they go
Designer David Wicks compares rainfall against water consumption in his thesis project Drawing…
-

Straight lines are surprisingly hard to draw with a mouse
Remember when you played Telephone as a kid? No matter how simple the…
-
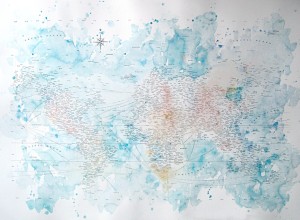
Typographic world map and water colors
Typographic maps are all the rage these days. Instead of drawing well-defined boundary…
-
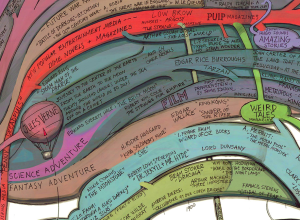
History and origins of science fiction
Artist Ward Shelley maps the history of science fiction in painstaking detail. See…
-

Entire movies compressed into single barcodes
Choice of color in a movie can say a lot about what’s going…
-
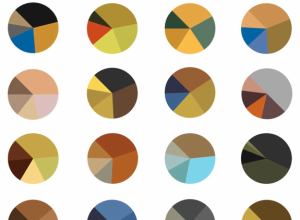
Vincent van Gogh paintings as pie charts
Arthur Buxton breaks down van Gogh paintings for a view of color schemes.…
-
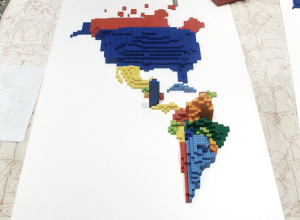
Lego cartograms show immigration and migration
LEGOs were my favorite toy growing up. This was back when the pieces…
-

Painting with light to show WiFi networks
WiFi is everywhere, floating and whirling around us somehow, but where is it…
-

Data visualization meets game design to explore your digital life
The list of one-off applications that visualize your digital life, whether it be…
-
Data in a physical context
We’ve seen this sort of thing before, but it doesn’t ever seem to…
-

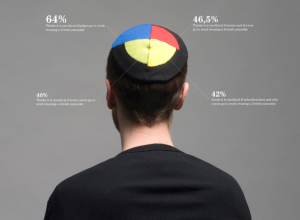
Reading the face of IBM’s Watson
Tonight on Jeopardy, the first day of the IBM Watson challenge, Ken Jennings…
-
Looking for other livable planets
Jer Thorp, who has a knack for creating stuff that’s both useful and…
-

Visualizing deletion discussions on Wikipedia
Fact is not always clear cut. Sometimes fact is driven by opinion. People…
-

Dynamic sculpture brings weather into airport
eCLOUD, conceived by Aaron Koblin, Nik Hafermaas, and Dan Goods, displays weather data…
-

Minimalised consumer products
Antrepo wonders what it might be like if the labels on consumer products…
Recently for Members
Second Edition
 Visualize This: The FlowingData Guide to Design, Visualization, and Statistics (2nd Edition)
 Visualize This: The FlowingData Guide to Design, Visualization, and Statistics (2nd Edition)
New tools, refined process.
Browse by Chart Type See All →


