The list of one-off applications that visualize your digital life, whether it be your Twitter feed, Facebook updates, or Foursquare checkins, has been growing for a short while. Ben Cerveny and Tom Carden, both Stamen Design alumni, aim to take this idea to the next level with Bloom, with elements of game design.
Our mission to bring you a new type of visual discovery experience is already underway. We’re building a series of bite-sized applications that bring the richness of game interactions and the design values of motion graphics to the depth and breadth of social network activity, locative tools, and streaming media services. These new ‘visual instruments’ will help you explore your digital life more fluidly and see patterns and rhythms in the online services you care about.
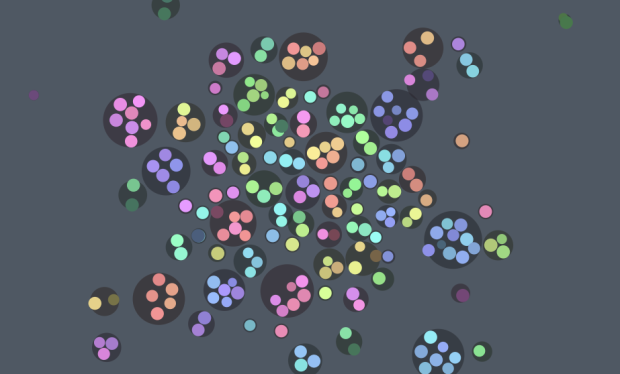
Bloom is still in development, but the team recently relaunched with a couple of visualizations that you can play around with. The first is Fizz (above), which lets you see your Twitter or Facebook feed develop. The second is Cartagram (below). It displays Instagram photos in a map layout.

About these two instruments, Cerveny notes:
What is important to realize about these, as with all of our coming applications, is that they are the foundations of a constant flow of ongoing iterative development, much like video game franchises.
And it’s not just about analysis and technical insights. Some applications will be analytical, yes, but others will be playful or lyrical or a combination of all of the above. Best of all, they’re designing with mobile in mind, too, which could really put it over the top.
I’ve been eagerly waiting to see what these guys have been working on, so it’s great to see the first works in action. Now I can’t wait to see what comes next.
[Bloom via infosthetics]
 Visualize This: The FlowingData Guide to Design, Visualization, and Statistics (2nd Edition)
Pingback: Introducing Fizz « Bloom Blog
Pingback: PSFK » Bloom: The Discovery Loop Of Data Visualization
Pingback: Open, Writing, Blogging, Visualization, and Random Bits | GoatRock Research
Wtf…. their new planetary vis is only for ipad.