James Grady from Fathom Information Design had a look at the family tree…
Data Art
Finding the beauty in numbers.
-
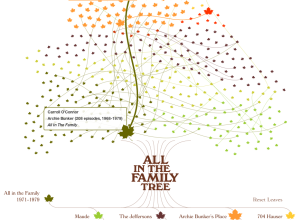
The family tree for All in the Family
-
Lunar Lander trails
In 1979, Atari released Lunar Lander, a game whose object was to land…
-
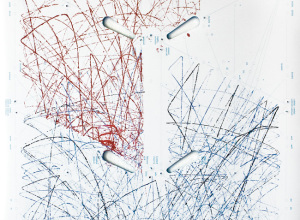
Pinball machine as Etch A Sketch
When you plan pinball, the ball bounces around creating paths for itself and…
-
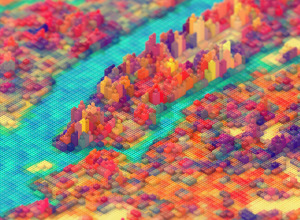
Lego New York
I’m not sure what these digitally rendered Lego blocks by JR Schmidt represent,…
-
Data visualization as cultural phenomenon
In 1979, Joy Division released their album Unknown Pleasures, and the cover was…
-
Beauty in movement
For the Made by Humans exhibit at the Hyundai Vision Hall in South…
-
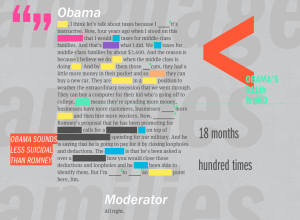
ReConstitution recreates debates through transcripts and language processing
ReConstitution 2012, a fun experiment by Sosolimited, processes transcripts from the presidential debates,…
-

Data sculpture shows emotional response to Olympics
During the Olympics, Studio NAND, Moritz Stefaner, and Drew Hemment tracked Twitter sentiment…
-

Make cool images with emergent algorithm
I’m not sure what I’d do with Ablaze.js, a JavaScript library by Patrick…
-
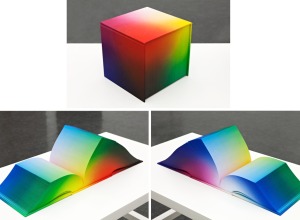
RGB Colorspace Atlas shows every shade in a cubic book
The 8-inch cube RGB Colorspace Atlas by artist Tauba Auerbach shows every color…
-
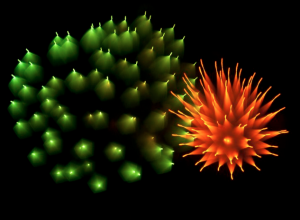
Long-exposure fireworks photos
Photographer David Johnson took long-exposure shots of fireworks. Fireworks already leave trails when…
-
Water Light Graffiti
Water Light Graffiti is an installation by Antonin Fourneau that lets you use…
-
Disney Research makes plants interactive
Botanicus Interacticus from Disney Research turns plants into multi-touch surfaces, simply by placing…
-
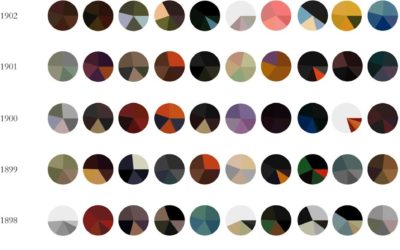
Paintings as pie charts →
Expanding on his Vincent van Gogh pie charts, Arthur Buxton minimalized famous paintings…
-

Celebrating the joy of metering →
Meters, by Berlin-based designers Patrick Kochlik and Monika Hoinkis, celebrates the joy of…
-
Short film imagines life with data and constant digital
In the what-happens-when-technology-takes-over-our-lives genre, Sight by Eran May-raz and Daniel Lazo, imagines a…
-
Olympic rings as data symbols
Artist Gustavo Sousa used the Olympic rings as data indicators for statistics like…
-
What planets would look like if they replaced our moon
Artist Brad Goodspeed imagined what the planets would look like if they were…
Recently for Members
Second Edition
 Visualize This: The FlowingData Guide to Design, Visualization, and Statistics (2nd Edition)
 Visualize This: The FlowingData Guide to Design, Visualization, and Statistics (2nd Edition)
New tools, refined process.
Browse by Chart Type See All →


