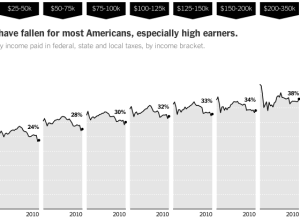
Mike Bostock, Matthew Ericson and Robert Gebeloff for the New York Times explored…
Statistical Visualization
Finding patterns, distributions, and anomalies.
-
How tax rates have changed →
-
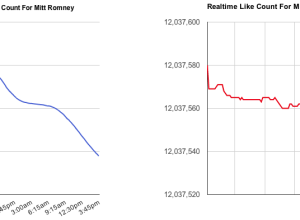
Mitt Romney losing likes on Facebook, in real-time
If you go to the Facebook page for Mitt Romney, note the number…
-
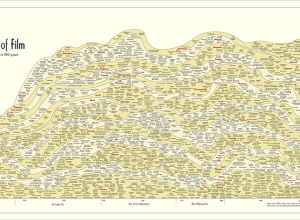
History of film, 100 years in a chart
In something of an homage to the Genealogy of Pop & Rock Music…
-
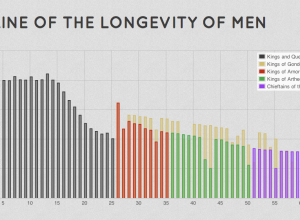
Lord of the Rings visualized
Driven by his love for Lord of the Rings, Emil Johansson explores the…
-
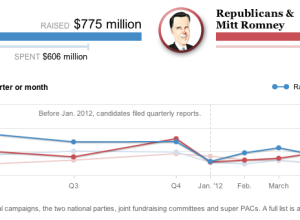
Presidential campaign finance explorer
Hey, I think it’s election season, and you know what that means. It’s…
-
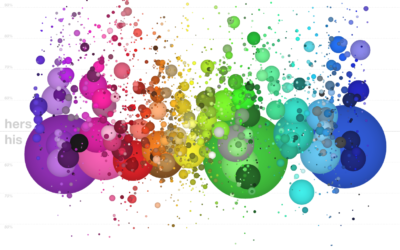
Color names plotted against gender
A couple of years ago, xkcd ran a survey that asked people to…
-
Animated political contributions
The Forest of Advocacy is a series of animations that explores the political…
-
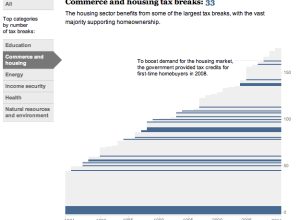
History of tax breaks →
Kat Downs, Laura Stanton and Karen Yourish of The Washington Post look at…
-
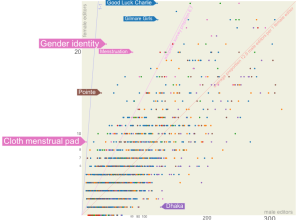
Wikipedia is dominated by male editors
After he saw a New York Times article on the gender gap among…
-
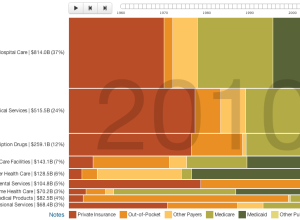
Who pays for healthcare, 1960 to 2010
Josh Cothran looked at who’s paid for healthcare over the past five decades,…
-
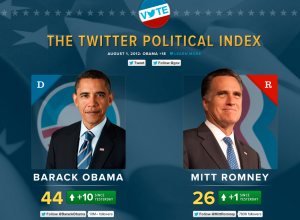
Twitter Political Index measures feelings towards candidates
In partnership with social analytics service Topsy, Twitter launched a Political Index that…
-
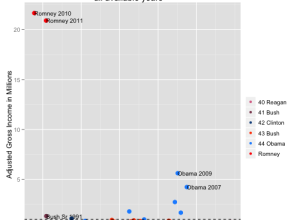
Comparing Romney’s tax returns to presidential returns →
Lee Drutman, a Senior Fellow at the Sunlight Foundation, compared the tax returns…
-
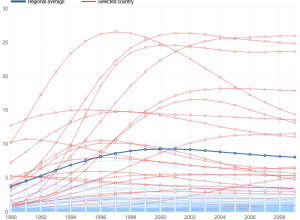
Tracking the spread of AIDS →
Adam Cole and Nelson Hsu for NPR plotted the percentage of people, ages…
-
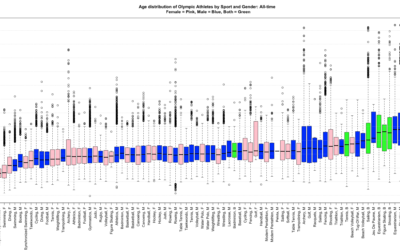
Olympian age distributions compared →
Last week, the Washington Post compared the ages of Olympians, but it only…
-
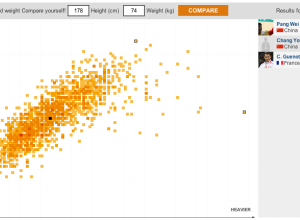
Where you measure up against Olympians →
I think the theme of this year’s Olympic graphics is how you relate…
-
Age range of US Olympic athletes, by sport
The Washington Post has a fun piece that compares your age to that…
-
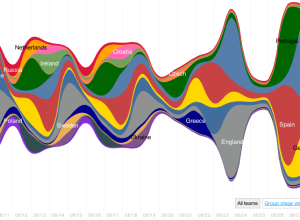
A graphical summary of Euro 2012 on Twitter
Nicolas Belmonte, a data visualization scientist at Twitter, visualized the change in tweet…
-
Link
Jeff Heer Interview →
Worth listening to whenever he talks visualization

 Visualize This: The FlowingData Guide to Design, Visualization, and Statistics (2nd Edition)


