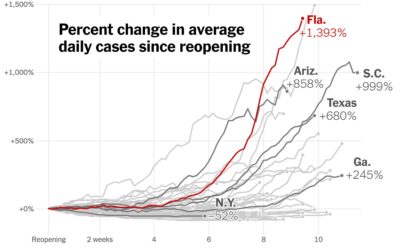
Using the now all too familiar baseline chart, where all of the time…
Statistical Visualization
Finding patterns, distributions, and anomalies.
-
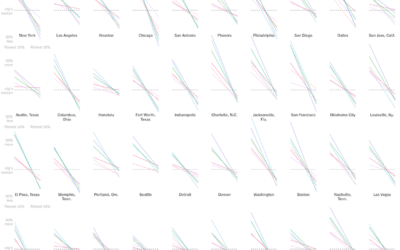
Increase in cases since states reopened
-
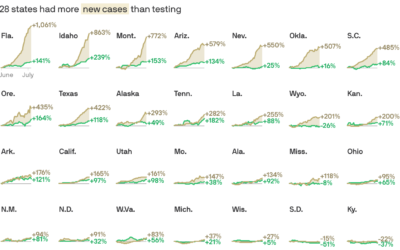
Cases vs. testing
There have been assertions that increased case counts are all from increased testing.…
-
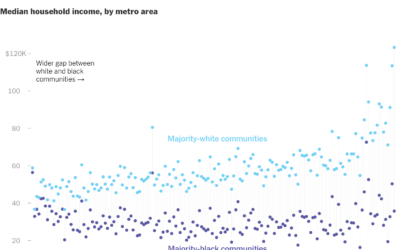
Gaps between black and white America
New York Times Opinion compared several demographics, such as unemployment and income, between…
-
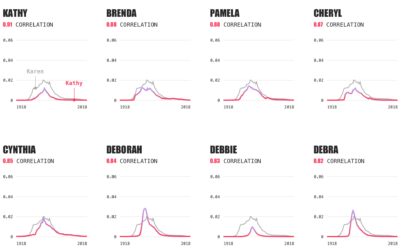
Karen equivalents, based on name data
The name Karen. It’s not a common baby name these days. It peaked…
-
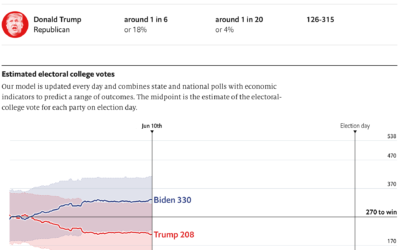
2020 election forecast
The Economist launched their 2020 elections forecast. Right now a part of my…
-
Health conditions and income
A large proportion of those who died from Covid-19 had pre-existing medical conditions.…
-
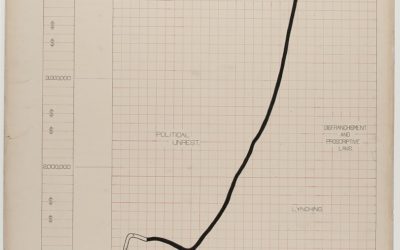
Visualizing black America in 1900
The visualization work of W.E.B. Du Bois and his students has been on…
-
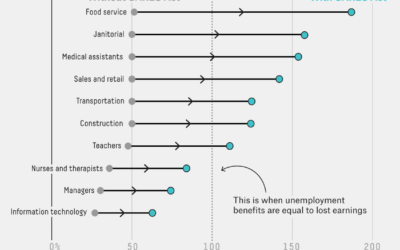
Where unemployment benefits are higher than lost wages
Economists at the University of Chicago analyzed unemployment benefits from the CARES act…
-
LEGO normal distribution animation
Let’s just animate all statistical concepts with LEGO from now on:
My daughter…
-
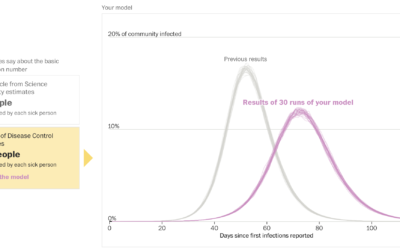
How experts use disease modeling to help inform policymakers
Harry Stevens and John Muyskens for The Washington Post put you in the…
-
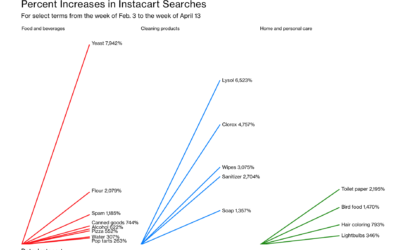
Change in Instacart searches after the coronavirus
For Bloomberg, Ellen Huet and Lizette Chapman reported on the jolt for Instacart…
-
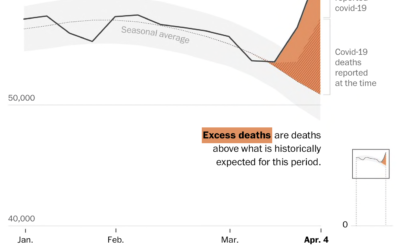
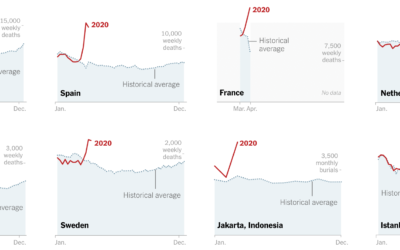
Excess deaths
We cannot know the true number of coronavirus-related deaths. Maybe it’s because of…
-
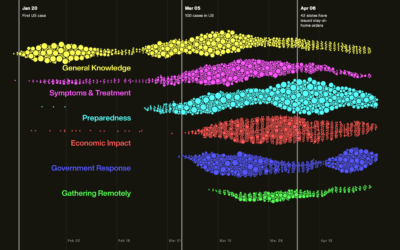
Search trends during the pandemic
As you would imagine, what we search for online shifted over the past…
-
Missing deaths
The daily counts for coronavirus deaths rely on reporting, testing, and available estimates,…
-
Historical data visualization panel
Manuel Lima hosted a free online panel with Michale Friendly and Sandra Rendgen…
-
BTS dance formations
BTS, the South Korean boy band, is apparently really good at dancing. Ketchup…
-
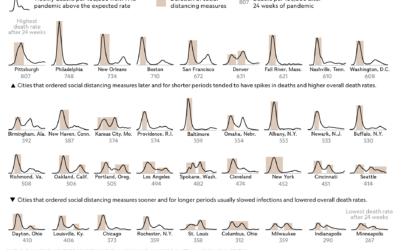
Curves for the 1918 flu pandemic
For National Geographic, Nina Strochlic and Riley D. Champine look back at the…
-
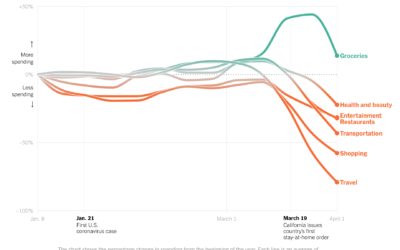
Change in consumer spending since the virus
Consumer spending has shifted dramatically since most people have to stay at home.…


 Visualize This: The FlowingData Guide to Design, Visualization, and Statistics (2nd Edition)


