Xaquín G.V. has a dead simple tutorial on how to make a choropleth map with open source QGIS.
Software
Programs and online applications to help you make use of data.
-
Link
A Choropleth in QGIS
-
Link
For Example
Mike Bostock, creator of D3, believes in using examples to show what can be done with his code.
-
Link
NlpTools
NlpTools is a PHP library for natural language processing.
-
Link
Polychart
Polychart just launched its open beta. “Lightweight visual analytics and business intelligence on the web.” Mainly, a drag-and-drop interface for quick charts.
-
Link
A Guide to Speeding Up R Code for Busy People
A Guide to Speeding Up R Code for Busy People. R can be slow at times. Here are some tips on getting it to go faster.
-
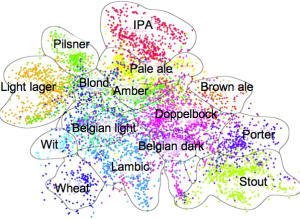
Beer Mapper: An experimental app to find the right beer for you
Kevin Jamieson, an electrical and computer engineering graduate student at the University of…
-
Link
Selections in D3
Mike Bostock continues to beef up the documentation and tutorials for D3. This one for selections.
-
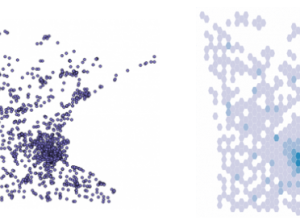
Binify for hexagon binning in Python
As an alternative to dot density maps, Binify by Kevin Schaul allows you…
-
Link
Extract CSV data from PDF files with Tabula
Extract CSV data from PDF files with Tabula. A collaborative project from Mozilla Open News.
-
Link
healthvis
The healthvis R package tries to make creation of interactive graphics easier by rendering in D3.
-
Link
Mining the Social Web
The example repository for Mining the Social Web if you’re interested in getting started. The Twitter examples rely on a soon to be defunct API, because the book was written in 2011, but the rest is still valid.
-
Link
Imperative vs Declarative
Imperative vs Declarative programming. In the former you tell the computer how to do something, whereas with the latter, you tell the computer what to do. Worthwhile knowing with the recent launch of Vega. [via]
-
Vega: A visualization grammar to create without programming
Visualization online can be a challenge if you don’t know how to program.…
-
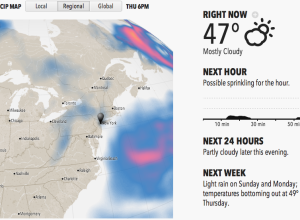
Forecast: A weather site that’s easier to read
When you go to one of the major sites to look up the…
-
Link
NLTK Book
The Natural Language Toolkit is a Python library that is commonly used to extract data from text. There’s a free, online-accessible book to learn how to use it.
-
Link
Visual Sedimentation
By Samuel Huron and Romain Vuillemot, Visual Sedimentation is “a JavaScript library for visualizing streaming data, inspired by the process of physical sedimentation.” Be sure to check out the examples.
-
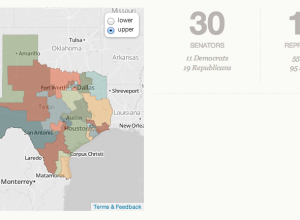
Learn about politics in your state with Open States
It’s not especially straightforward to know or find out what’s going on with…
-
Link
Advanced R development book
Hadley Wickham has been working on a book that covers advanced programming in R, namely programming concepts and workflow and package development. It goes to print later this year, but the contents are freely available for consumption now.
-
Link
Geocoding in Google Spreadsheets →
Nifty trick that uses Mapquest API as source
-
Link
iWantHue →
Automatically make a color palette based on color space
Recently for Members
Second Edition
 Visualize This: The FlowingData Guide to Design, Visualization, and Statistics (2nd Edition)
 Visualize This: The FlowingData Guide to Design, Visualization, and Statistics (2nd Edition)
New tools, refined process.
Browse by Chart Type See All →


