There’s no direct download, but there is an API.
Software
Programs and online applications to help you make use of data.
-
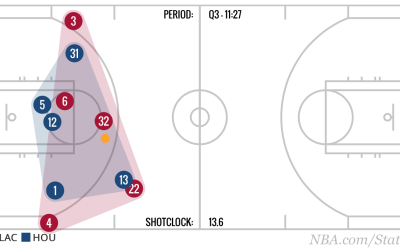
Extracting NBA player movement data
-
Link
sentimentr →
R package for sentiment detection.
-
Link
quartzFonts() →
Change graphic fonts with this R function in OS X.
-
Link
data diff →
Like diff for code but for data tables.
-
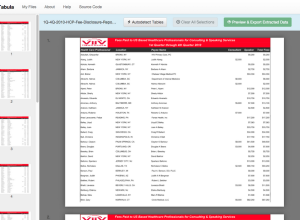
Extract data from PDF files and export to CSV
Tabula, available for Windows and Mac, lets you extract data from PDF files,…
-

Why government sites are outdated and very much not fun to use
Government data sites are typically sluggish and a pain to use. So many…
-
Tufte style charts in R
Lukasz Piwek is chipping away at a collection of Tufte-style charts using R,…
-
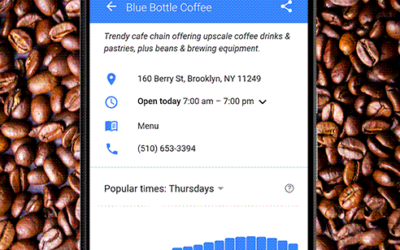
Avoid busy times at local businesses with Google
Waiting in line stinks. I purposely go to the grocery store during off-times…
-
Link
stringsAsFactors: An unauthorized biography →
In almost every tutorial on this site,
stringsAsFactorsis set toFALSEwhen you read in data with a function likeread.csv(). Why isn’t is just set toFALSEby default? Of course, there’s a perfectly logical explanation. -
Link
The Distillery →
A mini-app from Shan Carter to convert GeoJSON to TopoJSON. Simplify geometry and change projections along the way.
-
Link
imager →
An R package for image processing.
-
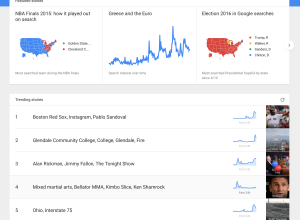
Google Trends in real-time
Google Trends used to be a place where you looked up trends for…
-
Link
CSV to HTML Table →
“Display any CSV file as a searchable, filterable, pretty HTML table. Done in 100% JavaScript.”
-

R is quirky, flawed, and an enormous success
Most people who use R on the regular learned the language in the…
-
Link
WikidataR →
An API client for the ‘Wikidata’ store of semantic data.
-
Link
mapturner →
“A command line utility for generating topojson from various data sources for fast maps.” Useful for use with D3.
-
Link
Datalib →
“Datalib is a JavaScript data utility library. It provides facilities for data loading, type inference, common statistics, and string templates.”
-
Link
Purifying the Sea of PDF Data, Automatically →
Jeremy B. Merrill is working on the problem of too much data in PDF files. “My pattern solves this problem using tabula-extractor, the Ruby library (and command-line tool) that powers Tabula. It’s built to output data to CSVs or to a MySQL database.”
-
Link
ArchieML →
“ArchieML (or ‘AML’) was created at The New York Times to make it easier to write and edit structured text on deadline that could be rendered in web pages, or more specifically, rendered in interactive graphics.” Less knowledge of markup language required.
-
htmlwidgets: Create interactive web charts in R
If you don’t want to bother with JavaScript but want to publish interactive…
Recently for Members
Second Edition
 Visualize This: The FlowingData Guide to Design, Visualization, and Statistics (2nd Edition)
 Visualize This: The FlowingData Guide to Design, Visualization, and Statistics (2nd Edition)
New tools, refined process.
Browse by Chart Type See All →


