There are two main reasons annotation is often a challenge. The first is…
Coding
Snippets to mess with data.
-
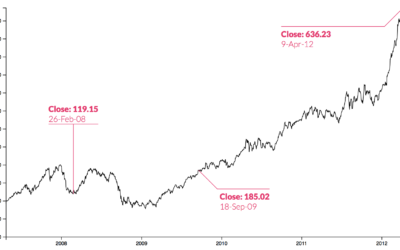
Making annotation easier with d3.js
-
Link
How to implement scrollytelling with six different libraries →
A brief look at six libraries to make your charts move as you scroll.
-
R for Excel users
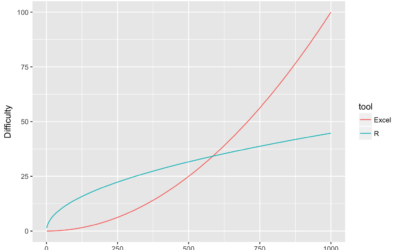
For Excel users getting started with R, pain oftentimes finds its way into…
-
Interpolate your data for animation in R
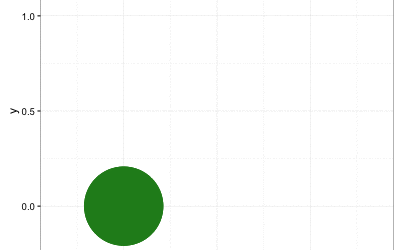
The tweenr package in R, by Thomas Lin Pedersen, helps you interpolate data…
-
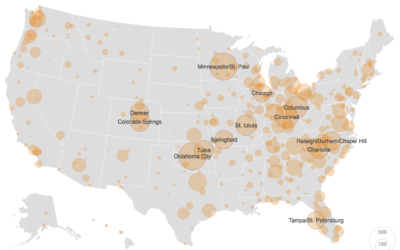
Floaty bubble charts with d3.js
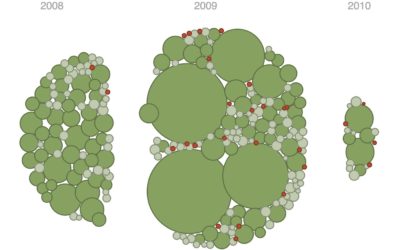
D3.js, or Data-Driven Documents, version 4.0 was released a few months ago, so…
-
Textured SVG patterns in JavaScript
In case you didn’t get the memo, pattern fills are back and so…
-
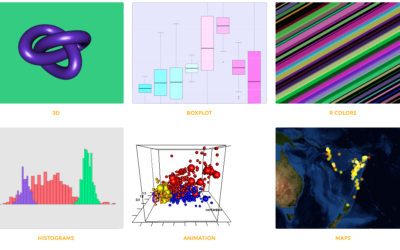
R graph gallery
One of best ways to learn visualization in any given software is to…
-
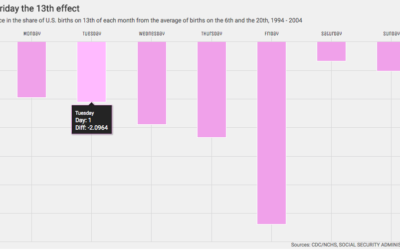
Interactive charts in R
Interactive charts in R are still so-so, but if you don’t mind giving…
-
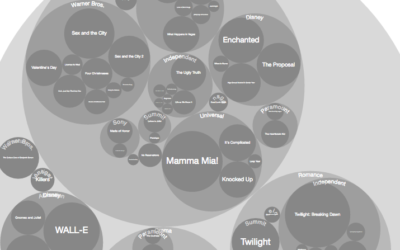
D3 in Depth
D3 is the most commonly used JavaScript library for visualization on the web,…
-
Practical tips for scraping data
It’s an unpleasant feeling when you have an idea for a project and…
-
Link
Animate gradient to imitate flow with d3.js →
Gain a sense of direction from otherwise static connections.
-
Link
d3.geo.statePlanes →
Nice projections for US states in D3.
-
Link
What Makes Software Good? →
Thoughtfulness in design from d3.js maker Mike Bostock. One of the main reasons I go with d3.js over other libraries.
-
Link
How do you learn d3.js? →
Small projects. Decide what you want to make first, and then figure out how to do it.
-
Link
Colors from images in R →
A how-to to break down images into just their colors.
-
Link
geomnet →
An R package for “Network visualization in the ‘ggplot2’ framework” by the folks at Iowa State.
-
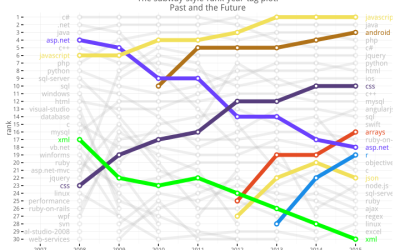
R growth on StackOverflow reigns supreme
Joshua Kunst did a quick analysis on tag usage on StackOverflow, the question…
-
Link
Squaire.js →
JavaScript library from Wall Street Journal to make the now popular square state grid.
-
Link
k-means + d3.js →
The simple clustering technique implemented with d3.js.
-
Link
Seaborn →
A Python library for visualization. Surprised I just heard of it.


 Visualize This: The FlowingData Guide to Design, Visualization, and Statistics (2nd Edition)


