If you can make maps in your software and customize the aesthetics, you…
Coding
Snippets to mess with data.
-
Making map art in R
-
SVG and CSS animations, without JavaScript
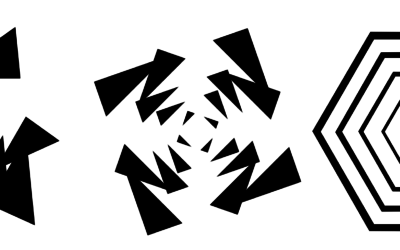
Andrew Wang-Hoyer built over 200 animations on and off over two years. They…
-
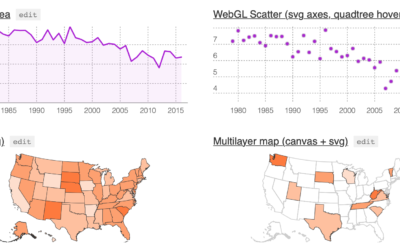
Layer Cake, a graphics framework for more flexible web graphics
Michael Keller released a new version of Layer Cake:
Layer Cake is a… -
Teaching R to 7th graders
Joshua Rosenberg describes his one-day experience teaching R to 7th graders:
[T]he activity… -
xkcd-style charts in JavaScript
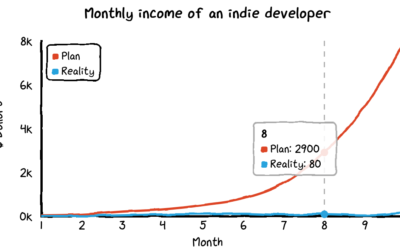
For xkcd fans, here’s a JavaScript library by Tim Qian that lets you…
-
Animating a lot of dots with WebGL and REGL.js
A couple of weeks ago, The Washington Post visualized 13,000 school districts using…
-
Bird’s-eye view of D3.js
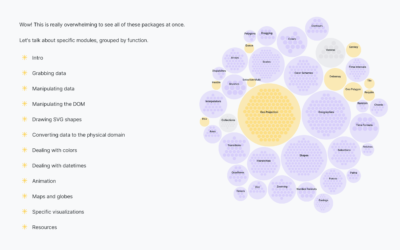
D3.js can do a lot of things, which provides valuable flexibility to construct…
-
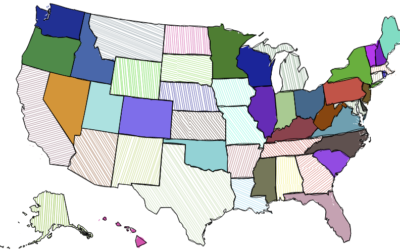
Hatching image effect in R
Here’s a fun thing to try in R. Jean Fan posted some code…
-
Link
Rough.js →
Create graphics with a hand-drawn, sketchy, appearance.
-
Field Guide to the R Ecosystem
If you’re looking to acquaint yourself with R — the non-coding aspects of…
-
Link
Automatic label placement along path →
Noah Veltman refined his label placement method, particularly useful for area graphs.
-
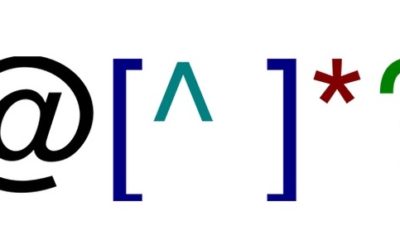
Introduction to regular expressions
If you want to analyze bodies of text, it’s a good to know…
-
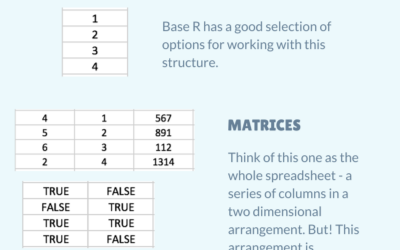
R data structures for Excel users
Introducing yourself to R as an Excel user can be tricky, especially when…
-
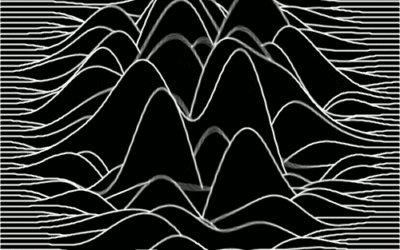
Drawing with noise
This looks like a fun Processing tutorial by Etienne Jacob. Use noise to…
-
Scrollama.js, a JavaScript library for scrollytelling
Russell Goldenberg released Scrollama.js in an effort to make scrollytelling more straightforward to…
-
Link
World Tile Grid Map in ggplot2 →
A straightforward tutorial on using squares instead of geographic boundaries.
-
Link
R or Python? →
Big community and lots of tools for both.
-
Link
d3-annotation 2.0 →
Next iteration of library for annotation. Made me delve into d3.js v4.
-
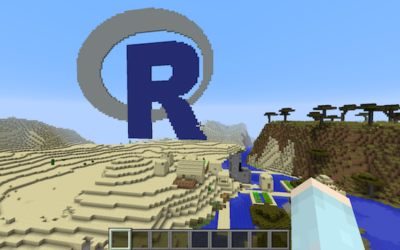
R programming with Minecraft
The new R package miner is an interface to Minecraft via some simple…
-
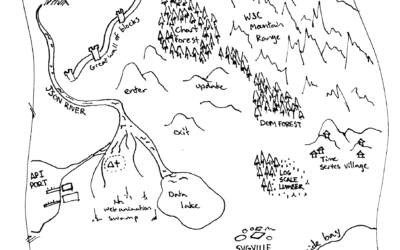
The Hitchhiker’s Guide to d3.js
Ian Johnson provides some good direction for those looking to get their feet…






 Visualize This: The FlowingData Guide to Design, Visualization, and Statistics (2nd Edition)


