If you have Netflix, you know that there’s a section for local favorites,…
Maps
Intuitive to look at spatial patterns and great for distributing geographic data.
-

Netflix favorites by location
-
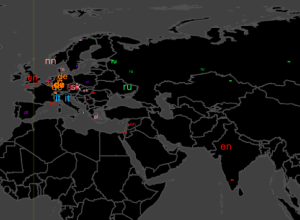
Geography of Wikipedia edits
A while back we saw the history of the world according to Wikipedia.…
-
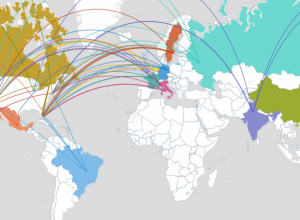
Community connections via SMS and phone call data
We often think of communities in the framework of government-set boundaries, but relationships…
-
Flickr and Twitter mapped together – See Something or Say Something?
For all the maps by Eric Fischer I’ve posted, it’s amazing how little…
-
Link
The History of Cartography →
Complete Volume 1 from 1987, available for free
-
In pursuit of the American dream (house)
Trulia Insights sure has been having fun lately. In their most recent dig…
-
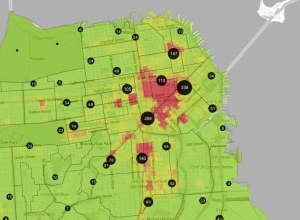
Trulia Crime Map helps you find safe living places
Real estate site Trulia made a great move when they acquired mapping outfit…
-
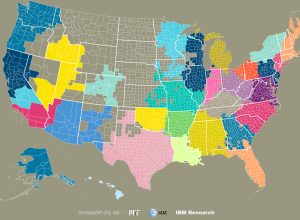
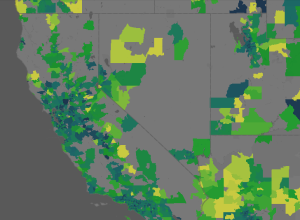
How we describe ourselves, according to online dating profiles
The traditional way to gauge who we are as a country, state, or…
-
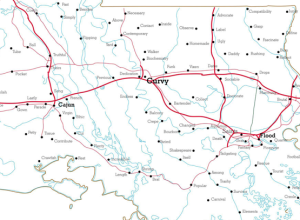
Find everywhere you can go in 15 minutes or less
A lot of the time when making plans to meet up with friends…
-
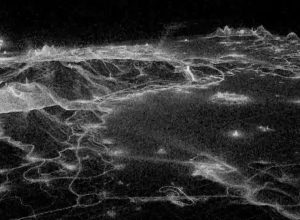
11.3m player deaths visualized in point cloud
Sometimes visualizing everything can turn out beautiful results. It seems to work especially…
-
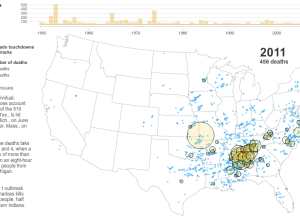
A deadly year of tornadoes
As reported by The New York Times, the tornado in Joplin, Missouri, known…
-
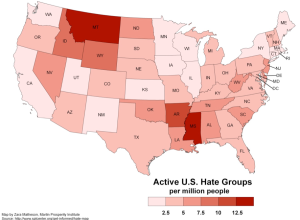
Geography of hate
Richard Florida for The Atlantic takes a closer look at hate groups in…
-
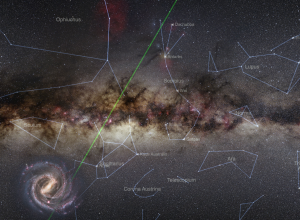
Super detailed map of the skies
The title just about says it all:
The Photopic Sky Survey is a… -
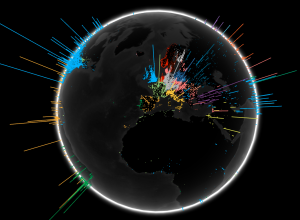
Global search volume by language
To show off their new toy that is WebGL, a 3D graphics API…
-
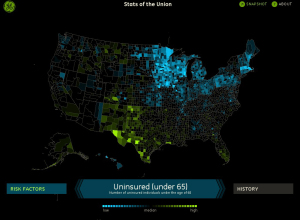
Stats of the Union tells health stories in America
Stats of the Union, the new Fathom-produced iPad app, maps the status of…
-
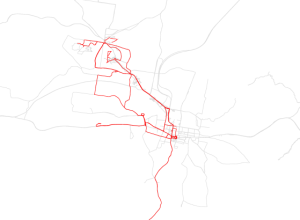
One man’s travel patterns – Atlas of the Habitual
FInding himself in a new town, with a new job, Tim Clark started…
-
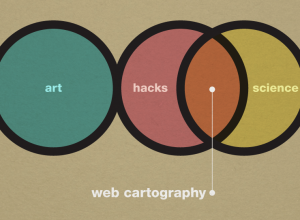
Art, science, and cartography
Similar discussions going on in the cartography branch among UW Madison geography folks.…
-
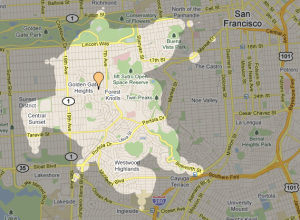
How long it takes for house prices to drop
Shopping for a house? Sometimes it can be advantageous to wait a while,…
Recently for Members
Second Edition
 Visualize This: The FlowingData Guide to Design, Visualization, and Statistics (2nd Edition)
 Visualize This: The FlowingData Guide to Design, Visualization, and Statistics (2nd Edition)
New tools, refined process.
Browse by Chart Type See All →


