National Geographic has a look at where and how we live:
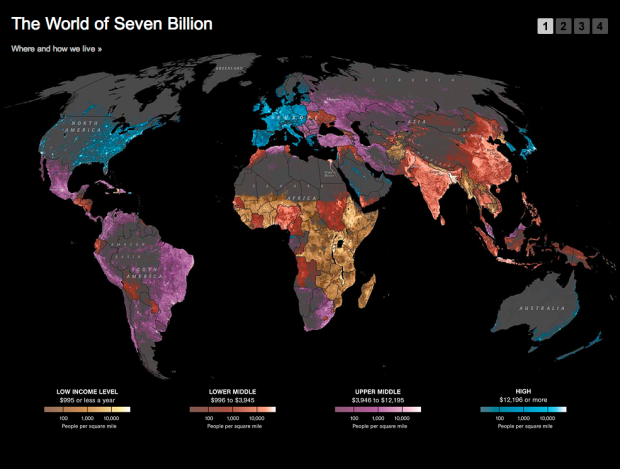
The map shows population density; the brightest points are the highest densities. Each country is colored according to its average annual gross national income per capita, using categories established by the World Bank (see key below). Some nations — like economic powerhouses China and India — have an especially wide range of incomes. But as the two most populous countries, both are lower middle class when income is averaged per capita.
It’s interesting, but the map is a little wonky, because the income levels and population densities differ in granularity. It kind of works. Kinda doesn’t. There seems to be a lot of missing data — or does population density in northern Africa really drop off that quickly (it is desert land, albeit)? A little more explanation in the description or the legend would have been useful.
There are also three other slides that follow the map (like the one below), but they’re mostly just run-of-the-mill list of facts with cutesy icons to show percentages. Not a fan of those at all. Actually, they kind of bother me.
![]()
I dunno, I’m on the fence here. What do you think?
[National Geographic | Thanks, Laura]
 Visualize This: The FlowingData Guide to Design, Visualization, and Statistics (2nd Edition)
Square *miles* bothers me – and most of the rest of the world.
agreed :)
Usually I kind of like the cutesy icon things in data, but this one is just annoying. I can barely make sense of the data from them. All of them are impossible to read, except the “fertility rate” and “internet use” ones.
“or does population density in northern Africa really drop off that quickly?” – I agree, represented like this it looks like some kind of enourmass desert of empty space around the sahara region ;)
@Al – Perhaps that’s because it is an enormous desert of empty space! I can quite believe the population density drops off sharply there as it will be the edge of the sands. Same with the huge chunk of empty space in North West China for the desert there.
I think AI had his sarcasm bit flipped there. He used an icon indicator for that… the winking smile.
It’s annoying that they don’t provide any sources to the data. They must have relied either upon LandScan (which estimates ambient pop at noon along roads) or CIESIN’s GPW (which assesses residential pop).
Is anyone else disturbed that the incomes aren’t normalized to the cost of living in those areas? What does it mean to be making $2k/yr in China vs. India vs. Sudan? I know that the blue representing $12k+/yr is a worthless representation of income in the United States, because $12k/yr is below the poverty line here. But you could probably live very well on that in southeastern Paraguay.
I really, really like the map. I agree that it would be nice to see where the underlying data comes from and to have a better feel for its accuracy across areas. But I think the map does a really excellent job of giving a feel for the proportions of humanity that live in different regions of the globe with different general levels of wealth. I think my daily intuition of this is skewed — I tend to severely discount the sheer number of people in sub-Saharan Africa, Indonesia, etc. — and the map offers a useful and enthralling corrective.
Looks like the income data is almost certainly just those 4 categories on a per-country basis; I’d expect to see at least a few instances of income levels varying within countries (e.g., the old DDR, coastal vs. rural China, potentially even some parts of the US and northern Canada if it had enough people to get any colour at all).
These guys didn’t know about all the data sets that are out there. See eg http://www.ngdc.noaa.gov/dmsp/pubs/Ghosh_TOGEOGJ.pdf for night lights as proxy of economic activity and Nordhaus 2008 http://journals.sfu.ca/int_assess/index.php/iaj/article/viewArticle/271 for 1deg x 1deg disaggregated GDP.
The graphics on the second screen are redundant and become cluttered. Perhaps they could have been more efficiently displayed as one graphic per category with the colored data bars as overlays and the numeric data listed to the side. It is also distracting to design the standard icons for all categories but then to vary the human figures on the population example. Viewers will seek meaning in the differentiation and find none.
Regarding the information:
As sources aren’t listed, the interactive media comes across as questionable or even invalid. There is a generic disclaimer at the bottom about data but no actual sources.
Upon reading the article, I counted references to 4 specific scientists but none to any data.
I also found it interesting that the photographers are credited with contributing to the effort but the interactive designers and artists are not. It’s good material but feels incomplete.
Since this material is presented in an interactive format from Nat Geo, we have certain expectations:
We assume that the information has undergone extensive research and editing. We should also consider if it is National Geographic’s duty or part of their process to include such resources. Is this something that should be considered when “infographics” are used? What are the existing rules of thumb for traditional articles that include photography and graphics and how should that evolve in the electronic information paradigm?
As the electronic media goes from being supplemental to the text publication to the primary means of distribution, I hope leaders such as National Geographic will blaze the trail and set new standards. I hope that the design of their electronic publications will remain relevant in the new environment and suggest that adding resources and references should be a large part of that design. Adding researchers and data artists to the design process will add value and relevance.
Wow, that was a bit much… oh, and the flip chart icons on the second screen do look like mounted machine guns!
It’s fascinating to see population distribution around the globe but it’s really a shame not to show income distribution at the same level of fidelity. Did anyone else want a zoom as well?
The population sudden drop-off around the Sahara looks correct. When you fly across there, it’s clear that almost nobody lives in that area, which is inhospitable in the extreme. The high population in Egypt around the Nile and the almost instant end of population just a few kilometers away is striking when seen from an airplane. The map above seems completely accurate in that respect.