When I’m feeling confused about what’s going on around me, I gravitate towards…
Nathan Yau
-
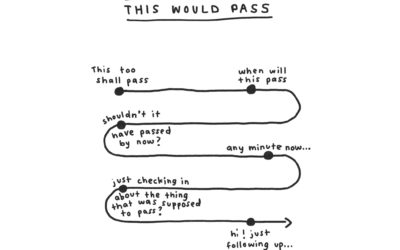
Humorous charts to organize thoughts
-
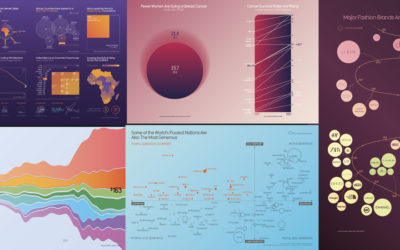
Beautiful News, a book charting the good things in the world
From David McCandless and team, who you might know from such books as…
-
Black neighborhoods split by highways
Rachael Dottle, Laura Bliss and Pablo Robles for Bloomberg on how urban highways…
-
Where Americans Live
Everyone gets a dot. You get a dot. And you get a dot. And you.
-
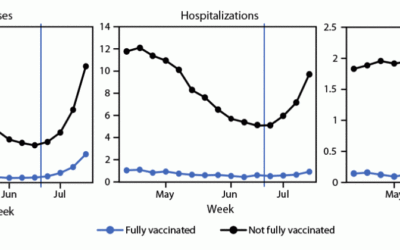
Cases, hospitalizations, and deaths for vaccinated vs. unvaccinated
The CDC released a chart that shows case, hospitalization, and death rates for…
-
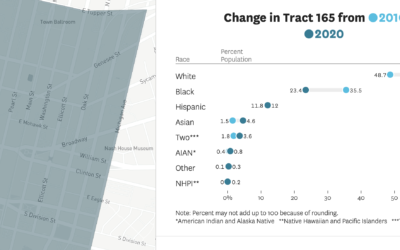
How the demographics of your neighborhood changed
The San Francisco Chronicle compares demographics in your neighborhood in 2020 against 2010.…
-
Data recorded in fabric quilt
Kim Moran-Jones quilted temperature minima and maxima in the UK, along with Covid-19…
-
Members Only
Chart Types or Visual Encodings – The Process 156
If I had to pick just one.
-
Atlas of the Invisible
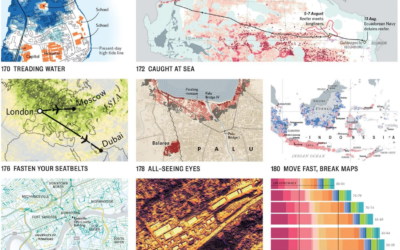
James Cheshire and Oliver Uberti teamed up for another book of maps, Atlas…
-
Black mortality gap
Anna Flagg, for NYT’s The Upshot, used dots arranged as a stacked area…
-
Bitcoin power usage
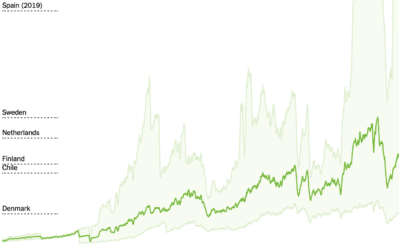
You might have heard that Bitcoin uses a lot of electricity. More than…
-
How Much More Time We Spent at Home
We had to do more from home. Here’s how much everything shifted by total minutes in a day.
-
Members Only
A Bar Chart Would Be Worse – The Process 155
Bar charts are the simple answer. Maybe you’re not looking for simple though.
-
New Orleans power outage seen via satellite imagery
After Hurricane Ida, New Orleans experienced power outages. The NASA Earth Observatory show…
-
How Humans Judge Machines
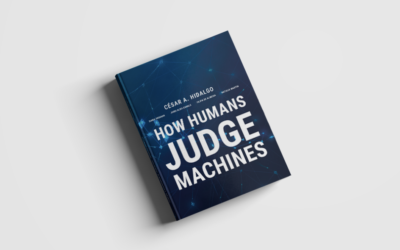
How Humans Judge Machines is an academic publication covering the results of experiments…
-
Tracking wildfires in the west
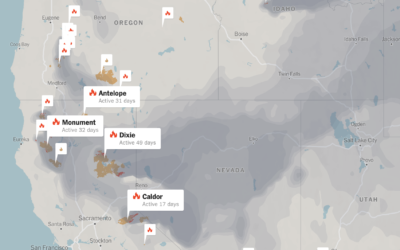
Wildfires continue to burn in the western United States. The New York Times…
-
AI-generated movie posters
Noah Veltman fed an AI movie descriptions and made it generate images. The…
-
Repulsive curves
Chris Yu, Henrik Schumacher, and Keenan Crane from Carnegie Mellon University are working…
-
Lightning algorithm
Matt Henderson on Numberphile shows off a “lightning algorithm” which is actually a…
-
Members Only
Visualization Tools and Learning Resources, August 2021
Here’s the good stuff for August.











 Visualize This: The FlowingData Guide to Design, Visualization, and Statistics (2nd Edition)


