This is part two in a seven-part series on basic rules for graph…
Nathan Yau
-
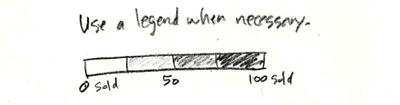
Graph Design Rule #2: Explain your encodings
-
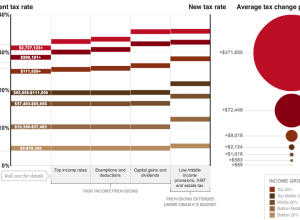
How tax breaks could affect your bottom line
Wilson Andrews and Alicia Parlapiano report for The Washington Post on how the…
-
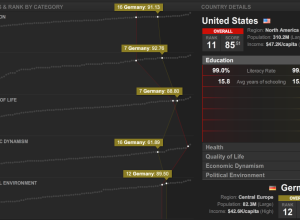
Countries of the world ranked by stuff
What country has the best education? Health? Quality of life? Thomas Klepl and…
-
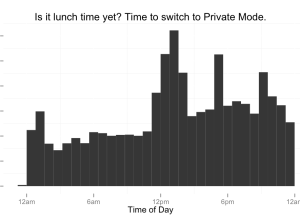
How people use private browsing
Private browsing. All the modern browsers have it. Turn it on, and the…
-
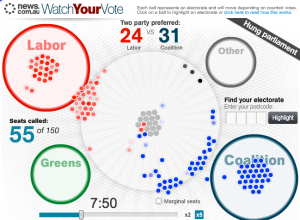
Election night in Australia relived
It was election night a few days ago in Australia, and News.com.au ran…
-
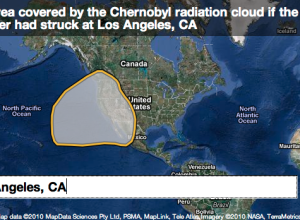
If major environmental disasters happened in your neighborhood…
When major environmental disasters occur, thousands of people are often affected, but it’s…
-
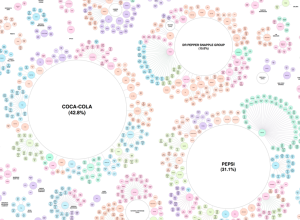
Pseudo-variety and ownership of the soft drink industry
When you buy soft drinks and other beverages at the grocery store, most…
-
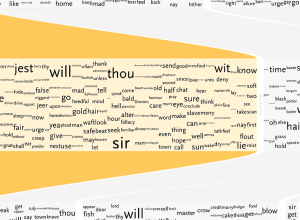
Understanding Shakespeare with visualization
Shakespeare literature is confusing. That’s not even an opinion. It’s a fact. Stephan…
-

Harvard scientist found guilty of misconduct
Shady research from Harvard scientist Marc Hauser is confirmed:
On Friday, Michael D.… -
Design advanced online and interactive maps with Polymaps
In a collaboration between SimpleGeo, who makes location data easier to access, and…
-
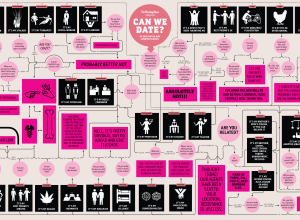
Is it okay to date your brother’s wife’s cousin? Flowchart it.
Dating can be tough. What should you talk about? Where should you go?…
-
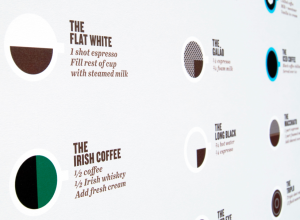
Comment to win a graphic guide to coffee drinks (poster) – winner announced
We saw this handy dandy coffee guide by Plaid Creative a while back.…
-

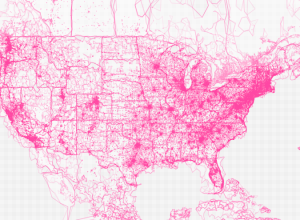
Bus movements in San Francisco animated
Eric Fischer has been having a good bit of fun with maps lately.…
-

How weather data became open data
Weather in the private sector is over a $1.5 billion industry, and it’s…
-
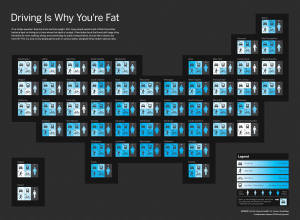
Discuss: Driving is why you’re fat?
In a collaboration between GOOD and Hyperakt, they come out with a bold…
-
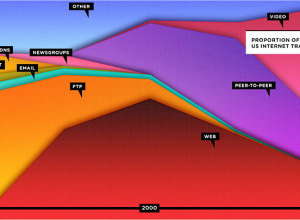
Stacked area shows the Web is dead?
Wired has declared that the Web is dead in their September cover story,…
-

Graph Design Rule #1: Check the data
Now that we’ve covered the 7 basic rules to graph design, it’s time…
-
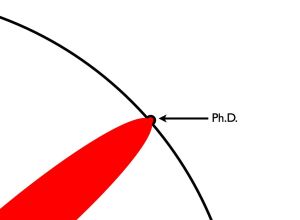
Illustrated guide to a PhD
When I first got in to graduate school, I really had no idea…
-
Stamen makes experimental prettymaps
Add another toy to Stamen’s bag of tricks. The recently launched prettymaps by…
-
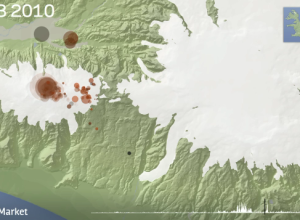
Animated map of earthquakes in Iceland
I’m late on this, but remember that volcano eruption in Iceland a few…
Recently for Members
Second Edition
 Visualize This: The FlowingData Guide to Design, Visualization, and Statistics (2nd Edition)
 Visualize This: The FlowingData Guide to Design, Visualization, and Statistics (2nd Edition)
New tools, refined process.
Browse by Chart Type See All →


