I have no idea what’s going on here, and I prefer to keep…
Nathan Yau
-
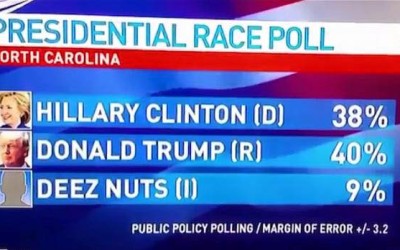
Decent presidential candidate options.
-
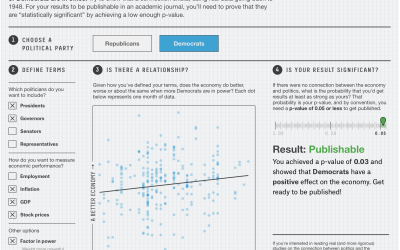
Lessons in statistical significance, uncertainty, and their role in science
Science is hard. Statistics is hard. Proving cause and effect is hard.
-

Hearing color instead of seeing it
Neil Harbisson is completely color blind, so he has a device that lets him listen to color.
-
Link
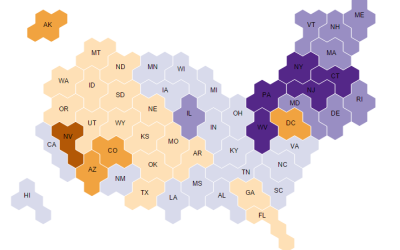
Make grid maps in Python →
A quick script for squares and hexagons that outputs to SVG.
-

Where the checked luggage goes
Schiphol Airport in Amsterdam put a camera on a piece of checked luggage…
-

Nuclear detonations from 1945 to present
There have been over 2,000 nuclear detonations since 1945. Orbital Mechanics mapped each…
-

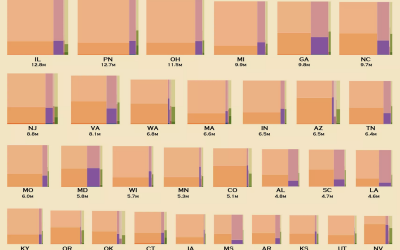
Mapped: Solar energy and savings if you got panels
Punch in your address. See how much you could save, based on a variety of data sources.
-
Link
What Chicken Nuggets Taught Me About Using Data to Design →
Ask yourself what the numbers represent.
-
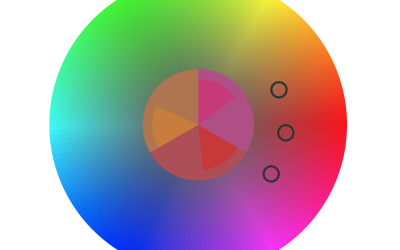
Game tests your color-matching skills
Simple and surprisingly challenging.
-
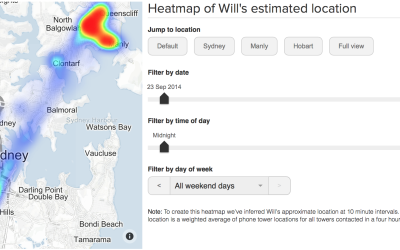
Surveillance selfie with cell phone metadata
Just because there’s no content that comes with the metadata doesn’t make the latter useless.
-
Link
data diff →
Like diff for code but for data tables.
-
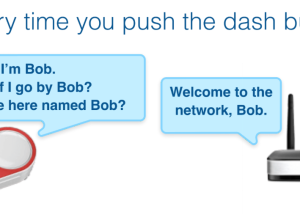
Using Amazon’s $5 button for personal data collection
Set it up in ten minutes.
-
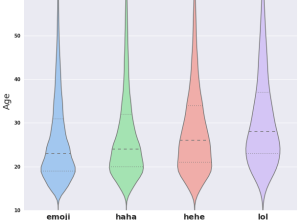
Demographics of laughter on the web
There are a handful of ways to express laughter online, and it appears…
-
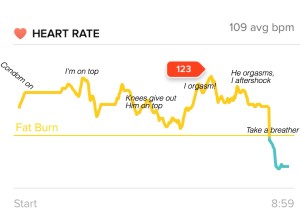
Fitbit during sex
Reddit user noveltysin wore a Fitbit during sex, and then posted a screenshot…
-
The Statistical Atlas that Keeps On Going
I already revived the first Statistical Atlas of the United States from 1870 with modern data, but there’s still more data to look at. So I kept on going.
-
Link
Using BuzzFeed’s listicle format to tell stories with maps and charts →
Peter Aldhous on his workflow and speeding up the visualization process for the news.
-

Real Chart Rules to Follow
There are rules—usually for specific chart types meant to be read in a specific way—that you shouldn’t break. When they are, everyone loses. This is that small handful.
-
The Price is Right winner and cancer survivor calculates the odds
Elisa Long, a professor in Decisions, Operations, and Technology Management at the University…
-

Denver Broncos testing in-game analytics
Analytics continues its spread into the various facets of sports. Just recently, the…
-
Disappearing Arctic reflected in National Geographic maps
In the most recent update to their atlas coming in September, National Geographic…
Recently for Members
Second Edition
 Visualize This: The FlowingData Guide to Design, Visualization, and Statistics (2nd Edition)
 Visualize This: The FlowingData Guide to Design, Visualization, and Statistics (2nd Edition)
New tools, refined process.
Browse by Chart Type See All →


