Uber uses psychology and video game mechanics to encourage drivers to work longer…
Nathan Yau
-
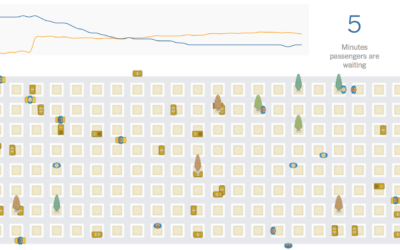
Visual simulations to show Uber game strategies
-
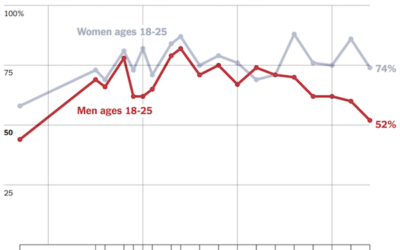
Millennial cherry-picking
Emily Beam highlights confirmation bias in articles recently suggesting that more millennial men…
-
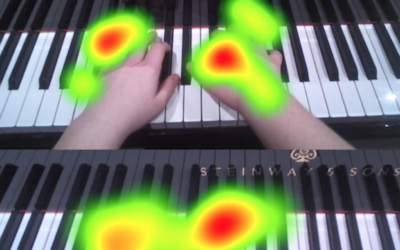
Pianist eye tracking
What does a pianist look at while playing? Put a pair of eye…
-
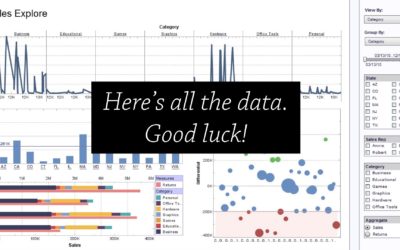
Visualization as skill set or stand-alone profession
Jumpstarted by Elijah Meeks asking why visualization people are leaving the field for…
-
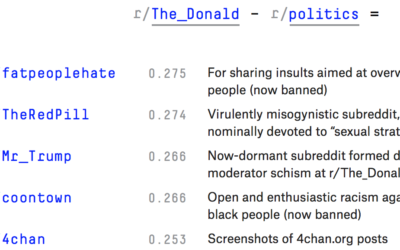
Subreddit math with r/The_Donald helps show topic breakdowns
Trevor Martin for FiveThirtyEight used latent semantic analysis to do math with subreddits,…
-
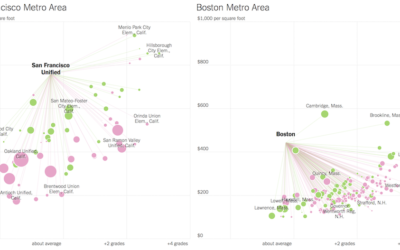
Looking for more affordable homes and better schools in the suburbs
Families often move out of the city to the suburbs for more affordable…
-
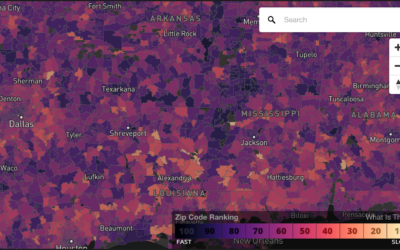
Compare your commute time to others
Commuting sucks. Here’s a straightforward map to compare how much or less your…
-
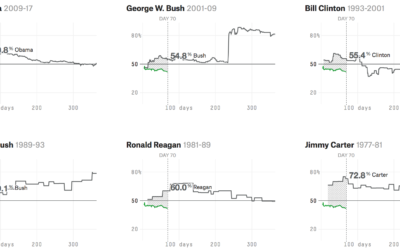
Trump approval ratings compared to past presidents
Using multiple polls as their source data, FiveThirtyEight is tracking approval and disapproval…
-
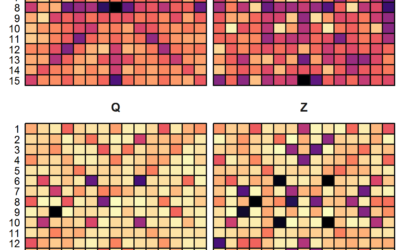
Scrabble data and analysis
Looking for some data to play with? James P. Curley compiled Scrabble data…
-
Complement data with emotion for full effect
Data is a great vehicle for arguments, but the (not just visual) perception…
-
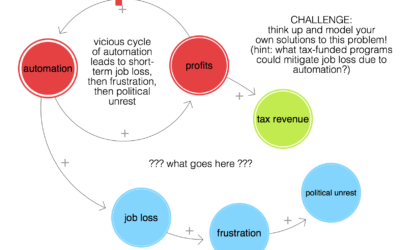
LOOPY is a tool to think in systems
Nicky Case, whose projects to simulate segregation and systems with emoji you might…
-

All major meteor showers, as seen from space
There are a lot of meteoroids circling around in space. Ian Webster visualized…
-
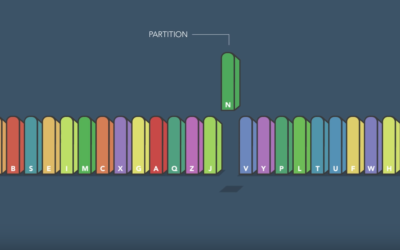
Fastest way to alphabetize your bookshelf
Sorting algorithms. Apparently there are an endless number of ways to visualize them…
-

Towards simple visualization
Irene Ros, the Director of Data Visualization at Bocoup, talks about her path…
-

Catching a real ball in virtual reality
Man wears virtual reality headset. Another man throws a ball to headset-wearing man.…
-
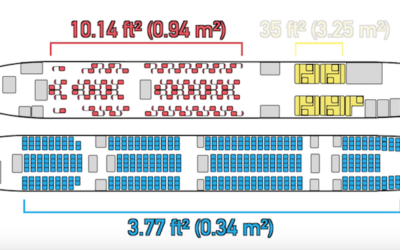
Economics of airline class
Wendover Productions explains basic economics of airline classes. The passengers in first class…
-
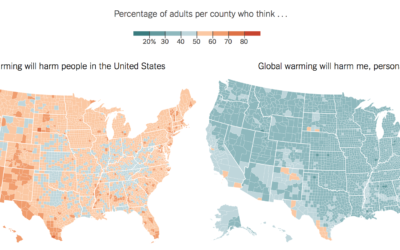
Conflicted public opinion about global warming
Based on estimates from the Yale Program on Climate Change Communication, The New…
-
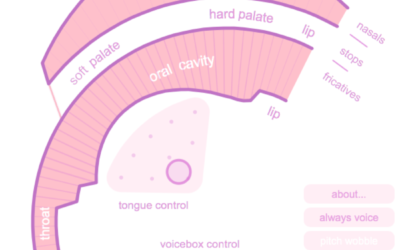
Simulation shows how your mouth works when you talk
You have a mouth with a bunch of tissue in it and manipulate…
-
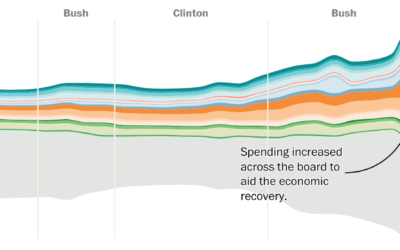
Shifting national budget
The Washington Post looks at the shifting national budget over the past 40…
-
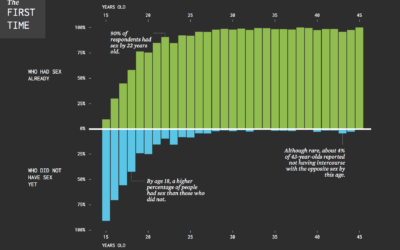
When Straight Americans Lost Their Virginity
Everyone has his or her own timeline, but here it is in general for Americans.
Recently for Members
Second Edition
 Visualize This: The FlowingData Guide to Design, Visualization, and Statistics (2nd Edition)
 Visualize This: The FlowingData Guide to Design, Visualization, and Statistics (2nd Edition)
New tools, refined process.
Browse by Chart Type See All →


