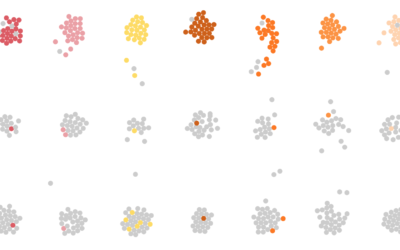
I simulated a day for employed Americans to see when and where they work.
Nathan Yau
-
A Day in the Life: Work and Home
-
Breathing Earth of vegetation
Using data from NOAA STAR, Nadieh Bremer creates a breathing Earth that shows…
-
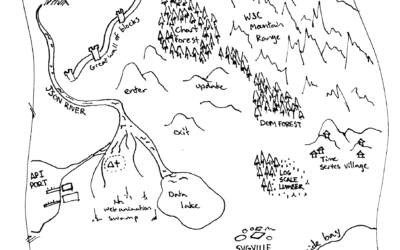
The Hitchhiker’s Guide to d3.js
Ian Johnson provides some good direction for those looking to get their feet…
-
Gerrymandering game shows you how it works
Gerrymandering is the practice of manipulating boundaries in such a way that favors…
-
Census Bureau budget cuts
The unexpected resignation of Census director John H. Thompson was likely related to…
-
Census director resigns
The U.S. Census director John H. Thompson resigned and will leave June 30.…
-
How the Average Working Adult Spends Days
This is what you get when you add up all the days the average American adult spends sleeping, eating, commuting, and doing other activities.
-
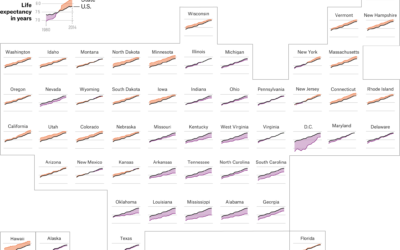
Life expectancy by state, against the US average
FiveThirtyEight continues their look at mortality by geography. This graphic by Anna Maria…
-
X-Ray of the oceans
Using satellite data and spatial models, researchers estimate human influence in the ocean.…
-
Criticism vs. Creation
Filmmaker Kevin Smith talks about making things versus critiquing them. He’s talking about…
-
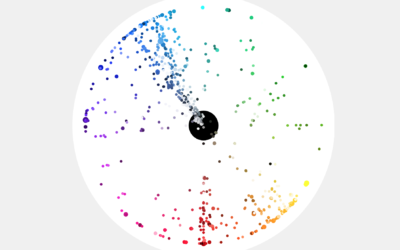
Most popular colors used by most popular sites
Paul Hebert was curious about the colors used on the web’s larger sites,…
-
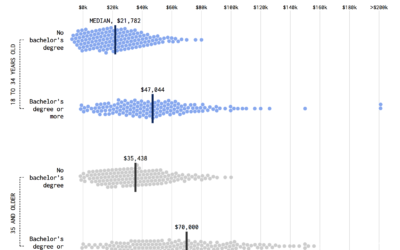
Shifting Incomes for Young People
Compare incomes for young people from the Millennial generation and the baby boomer generation.
-
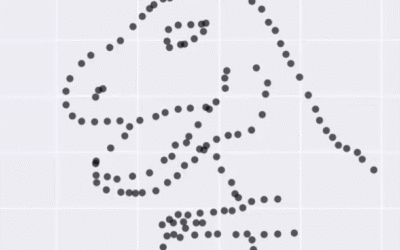
Same summary statistics, completely different plots
Summary statistics such as mean, median, and mode can only tell you so…
-
Sandwich alignment chart
By @matttomic, this chart speaks to me.…
-
xkcd: Algorithms are hard
Yeah, but what if you combine and overlay all these datasets? [xkcd]…
-
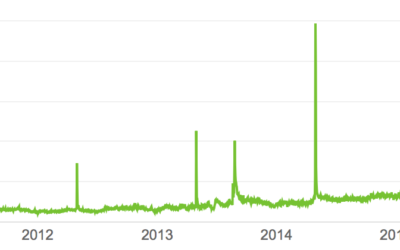
YouTube plays for ‘It’s Gonna Be May’
It’s that time of year again. Turn up the volume and blast It’s…
-
Life expectancy if all diseases were magically cured
Here’s a fun what-if simulation that imagines a world where all natural causes…
-
Data exploration banned
Statistician John Tukey, who coined Exploratory Data Analysis, talked a lot about using…
-
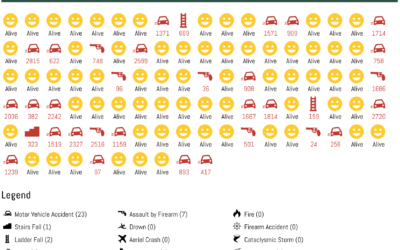
Fatal Traffic, When and Where
These are the traffic crashes that resulted in deaths in 2015, categorized by month, time of day, and factors involved.
-
Mapping death in America, 1980 to 2014
Nationwide mortality data relies on death certificates, and when cause of death is…









 Visualize This: The FlowingData Guide to Design, Visualization, and Statistics (2nd Edition)


