Elizabeth Warren has big plans, and they would cost a lot with a…
Nathan Yau
-
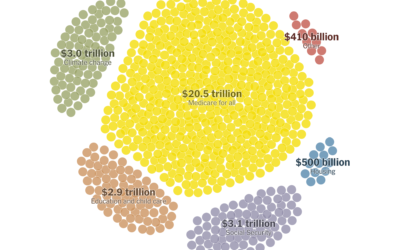
Paying for Elizabeth Warren’s proposed policies
-
Members Only

Cleaning and Formatting Data, What I Use (The Process #64)
There are many tools to clean up your data, and they can be helpful with the right dataset and situation. I tend to stick to a small handful. Here’s what works for me.
-

Randall Munroe of xkcd on Data Stories
Randall Munroe of xkcd was on the Data Stories podcast. He talks about…
-
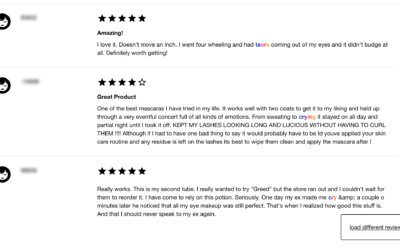
Sephora dataset is a collection of makeup reviews that mention crying
Interested in reviews on the Sephora website for waterproof makeup, Connie Ye figured…
-
Data shelf life
Stephen M. Stigler argues that data have a limited shelf life. The abstract:…
-
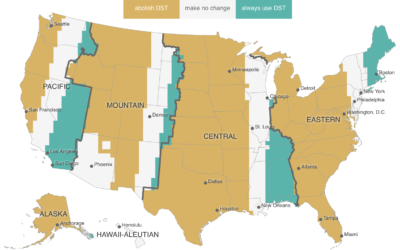
Daylight Saving Time gripe assistant tool
In a follow-up to a map from a few years back, Andy Woodruff…
-
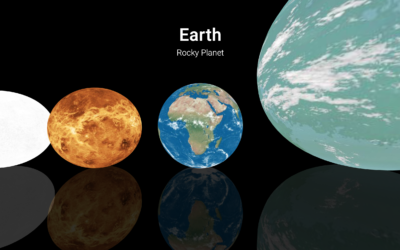
Scale of space browser
I always enjoy me some scale of space graphics. Neal Agarwal made an…
-
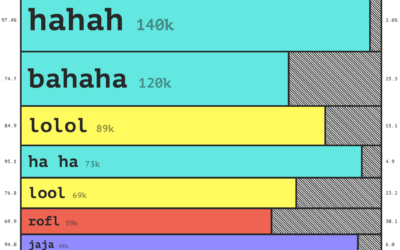
How people laugh online
Laughter online is full of nuances. A capitalization of some letters or a…
-
Members Only

Visualization Tools, Datasets, and Resources, October 2019 Roundup (The Process #63)
Every month, I collect new visualization tools, code, and datasets, along with helpful resources. Here’s the good stuff for October.
-
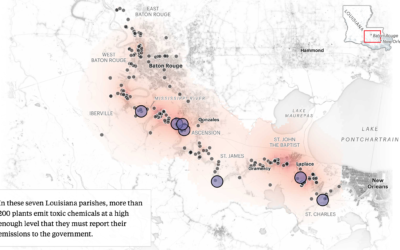
Mapping chemical plants, the pollution around them, and more chemical plants
ProPublica, with The Advocate and The Times-Picayune, estimated chemical concentrations in a highly…
-

When Americans Reach $100k in Savings
It was reported that 1 in 6 millennials have at least $100,000 saved. Is this right? It seems high. I looked at the data to find out and then at all of the age groups.
-
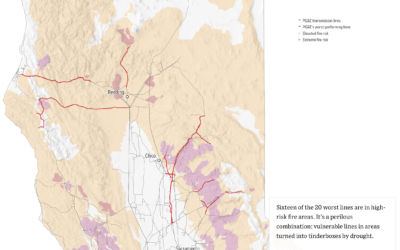
Worst performing circuits mapped with fire risk
This month PG&E has been shutting down power to thousands of households in…
-
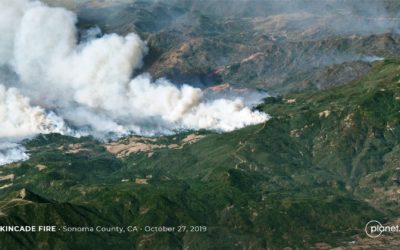
High-resolution satellite image of Kincade fire, up close from far away
I feel like satellite imagery has upped its skillset in recent years. According…
-
Kincade fire in Sonoma County via satellite imagery
You can see the time-lapsed imagery with this browser. [via @weatherdak]…
-
The Myth of ‘Dumbing Down’
For The Atlantic, Ian Bogost on communicating complex ideas to an audience:
One… -
How Charts Lie
Charts can reveal truths that we never would see otherwise, but they can…
-

Visualizing the Friends sitcom
Marion Rouayroux, a graphic designer and a big fan of the show Friends,…
-
Members Only
How to Use IPUMS Extraction Tools to Download Survey Data
Almost all of my visualization projects that use data from the Census Bureau comes via IPUMS. In this guide, I provide five steps to getting the data you need using their tools.
-
Members Only

Analysis as Detective Work (The Process #62)
Analysis and visualization are often a messy process that never matches up to the step-by-step guides you read, but that’s normal.
-
Cleaning your data with Excel and Google Spreadsheets
For Datawrapper, Lisa Charlotte Rost outlines the steps to prepare and clean your…
Recently for Members
Second Edition
 Visualize This: The FlowingData Guide to Design, Visualization, and Statistics (2nd Edition)
 Visualize This: The FlowingData Guide to Design, Visualization, and Statistics (2nd Edition)
New tools, refined process.
Browse by Chart Type See All →


