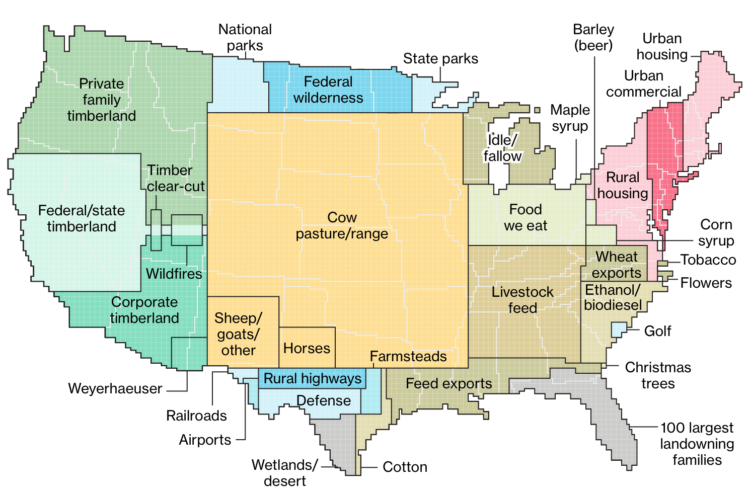
Dave Merrill and Lauren Leatherby for Bloomberg visualized land use for the conterminous United States using a pixel-like grid map:
The 48 contiguous states alone are a 1.9 billion-acre jigsaw puzzle of cities, farms, forests and pastures that Americans use to feed themselves, power their economy and extract value for business and pleasure.
Using surveys, satellite images and categorizations from various government agencies, the U.S. Department of Agriculture divides the U.S. into six major types of land. The data can’t be pinpointed to a city block—each square on the map represents 250,000 acres of land. But piecing the data together state-by-state can give a general sense of how U.S. land is used.
The above map is the full aggregate, but be sure to click through to see the comparisons across categories. Using a scrollytelling format, the graphics are a hybrid of grid maps and square pie charts. States serve as a point of reference. They’re the banana for scale. I like it.
 Visualize This: The FlowingData Guide to Design, Visualization, and Statistics (2nd Edition)