Harry Stevens and John Muyskens for The Washington Post put you in the…
Nathan Yau
-
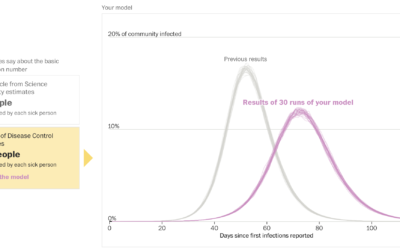
How experts use disease modeling to help inform policymakers
-

Map shows US typefaces named after cities in their geographic location
For The Statesider, Andy Murdock wondered how many typefaces are named after American…
-
Coronavirus Visual Rundown, Part II (The Process 089)
This issue of The Process is public.
Hi,
Nathan here. This is The… -
Explore Explain is a new visualization podcast about how the charts get made
From Andy Kirk, there’s a new visualization podcast in town:
Explore Explain is… -
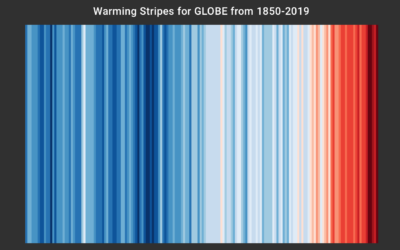
Global warming color stripes, as decorative conversation starter
Ed Hawkins, who you might recognize from charts such as spiraling global temperature…
-

Climate change displayed, with shower tiles
Based on a chart by Ed Hawkins, the shower wall of Gretchen Goldman…
-
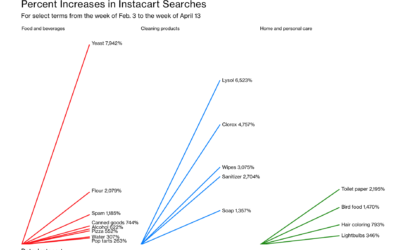
Change in Instacart searches after the coronavirus
For Bloomberg, Ellen Huet and Lizette Chapman reported on the jolt for Instacart…
-

Bread Scheduler
Is bread-making still a thing, or is that so two weeks ago? If…
-

Making stupid Excel bar charts
I’m just gonna put this right here, from @_daviant: “Another day another stupid…
-
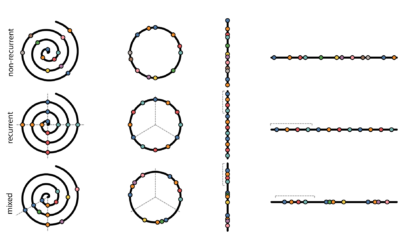
Evaluating timeline layouts
To show events over time, you can use a timeline, which is often…
-
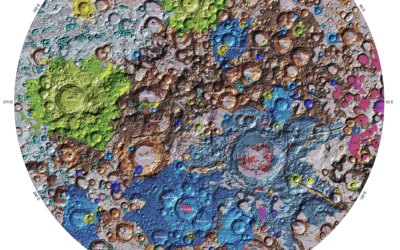
First unified geologic map of the moon
The USGS released a unified geologic map of the moon on a 1:5,000,000-scale…
-
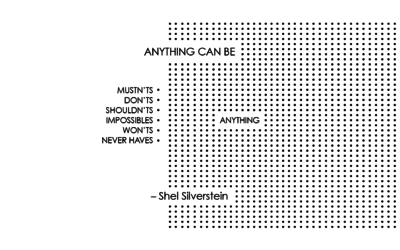
Famous Hope Quotes as Charts
I thought we (i.e. me) could use a break, so I made these abstract charts to represent the most popular quotes about hope.
-
Members Only
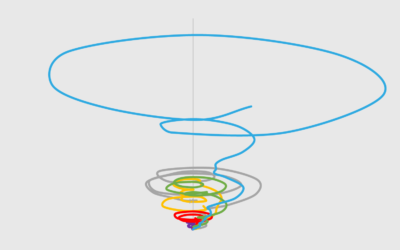
Tornado Lines – Useful or Not? (The Process 088)
It looks like a tornado. It’s messy. It’s circular. It almost looks intentionally confusing. But how bad is it really?
-
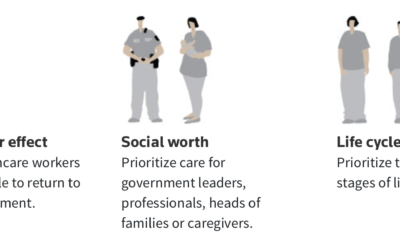
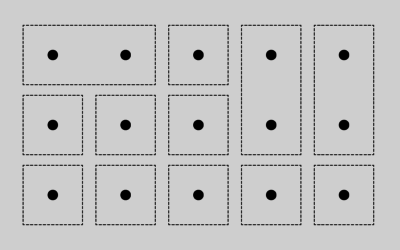
Who should receive care first, an ethical dilemma
At greater disparities between low resources and high volumes of sick people, doctors…
-

Remix and make music with audio from the Library of Congress
Brian Foo is the current Innovator-in-Residence at the Library of Congress. His latest…
-
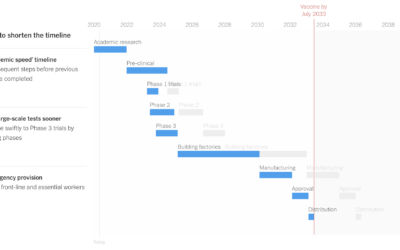
Possible vaccine timelines
It’d be great if we could conjure a vaccine or a “cure” seemingly…
-
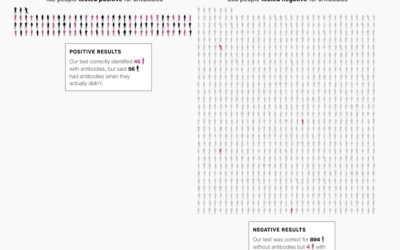
Coronavirus testing accuracy
Medical tests do not always provide certain results. Quartz illustrated this with the…
-
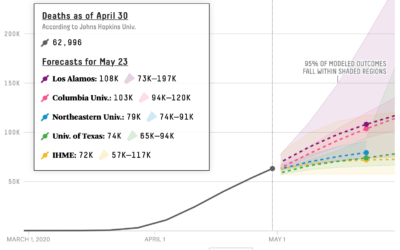
Comparing Covid-19 models
FiveThirtyEight compared six Covid-19 models for a sense of where we might be…
-
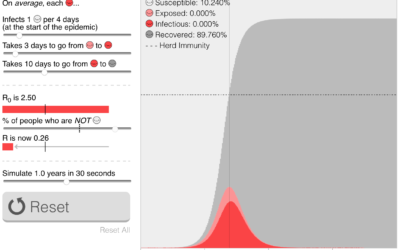
Playable simulations to decide what happens next
The timelines keep shifting and people are getting antsy for many valid (and…
-
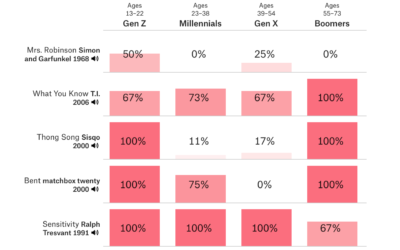
Looking for generational gaps in music
Inspired by the genre of YouTube videos where younger people listen to older…
Recently for Members
Second Edition
 Visualize This: The FlowingData Guide to Design, Visualization, and Statistics (2nd Edition)
 Visualize This: The FlowingData Guide to Design, Visualization, and Statistics (2nd Edition)
New tools, refined process.
Browse by Chart Type See All →


