Ren Yuan visualized the GitHub commit history for the PyTorch library. The virtual…
2024
-

Visualizing GitHub commit history in a 3-D virtual space
-

Hockey player tracking projected on ice for live watch party
During the Dallas Stars away games during this year’s NHL playoffs, fans could…
-
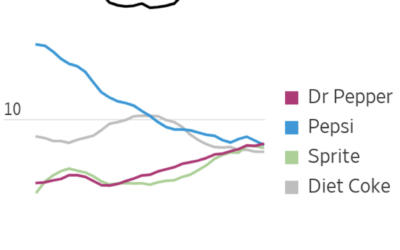
Dr Pepper ties with Pepsi-Cola for number two soda
Dr Pepper steadily rose and Pepsi steadily declined over the past couple of…
-
Members Only
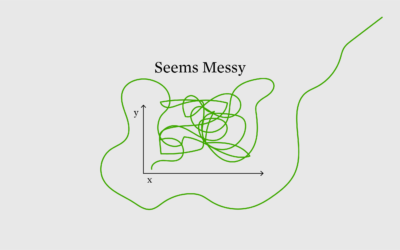
Chart Options to Cut Through the Noise and See Patterns
Sometimes the noise in a dataset makes it hard to see the worthwhile patterns when you visualize it. Here are chart options for you.
-

About a dog
For NYT, Sam Anderson, with illustrations by Gaia Alari, tells the story of…
-

Currently, a light display that shows where your energy is from
Currently is a prototype ambient display that shows where your energy comes from.…
-
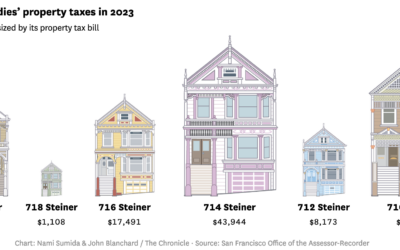
California property taxes, through the Painted Ladies houses
The Painted Ladies houses, which includes the house from the 1990s sitcom Full…
-
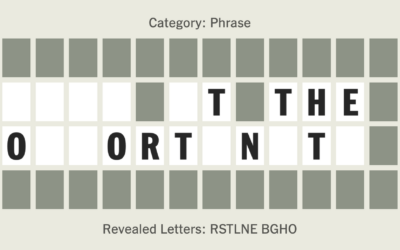
Wheel of Fortune analysis for the win
A Wheel of Fortune contestant employed strategies outlined in a NYT Upshot analysis…
-
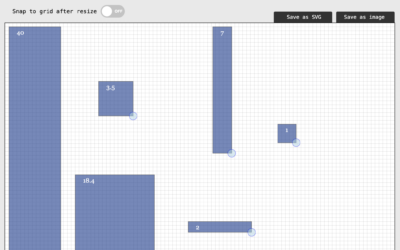
Simple tool for proportional area charts
There might be times when you want to visualize data with area, but…
-
Members Only

Visualization Tools and Learning Resources, May 2024 Roundup
Here’s the good stuff for the month.
-

On the PolicyViz Podcast →
I had a chat with Jon Schwabish on The PolicyViz Podcast. We talked…
-
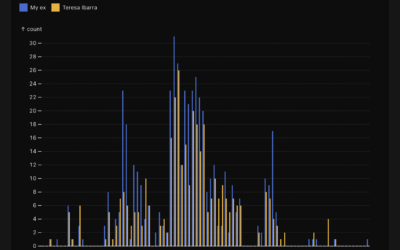
Analysis of text messages with an ex-boyfriend
Teresa Ibarra used Facebook Messenger to text with her now ex-boyfriend almost a…
-
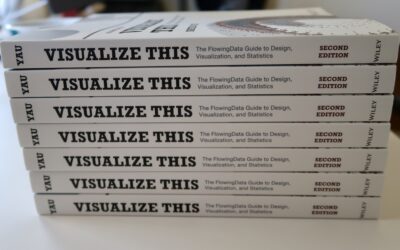
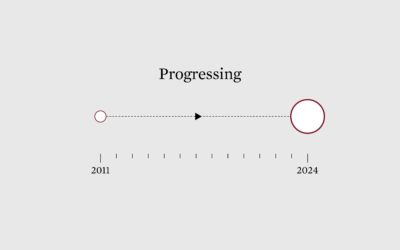
Visualize This: Publication Day, Fourteen Years Later
The second edition of Visualize This is published. The book made its way…
-
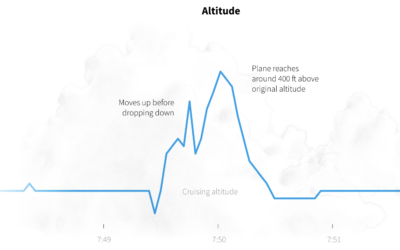
Flight turbulence on the Singapore Airlines flight, visually explained
Last week, a Singapore Airlines flight experienced turbulence that led to one person…
-
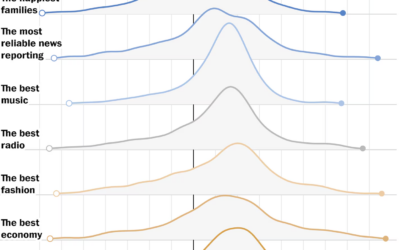
When feelings of nostalgia peak
YouGov surveyed 2,000 adults asking them when was the best and worst decades…
-

WildChat, a dataset of ChatGPT interactions
In case you need a large dataset to train your chatbot — and…
-
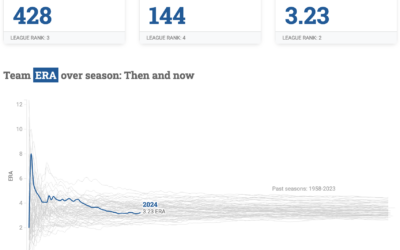
Dashboard for L.A. Dodgers baseball
To keep track of performance, Matt Stiles made the Dodgers Data Bot, which…
-
Members Only
Writing a Book About Visualization
Reading the words of my younger self and revisiting that guy’s process was… educational.
-
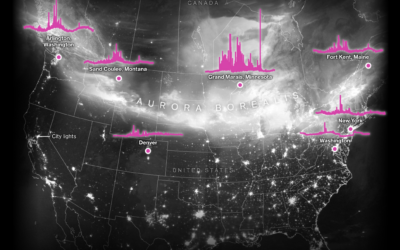
Energy surges due to solar storm
The recent solar storms brought pretty lights to the night sky in some…
-

Change in housing prices where you live
I don’t know about you, but where I live, the housing prices keep…
Recently for Members
Second Edition
 Visualize This: The FlowingData Guide to Design, Visualization, and Statistics (2nd Edition)
 Visualize This: The FlowingData Guide to Design, Visualization, and Statistics (2nd Edition)
Browse by Chart Type See All →


