There are a lot of visualization-related tools out there. Here’s a simple categorized…
2017
-
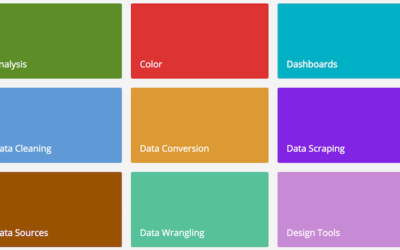
Catalog of visualization tools
-

Embedding.js: Data-driven environments for virtual reality
Embedding.js is a work-in-progress JavaScript library by Beau Cronin that makes it more…
-

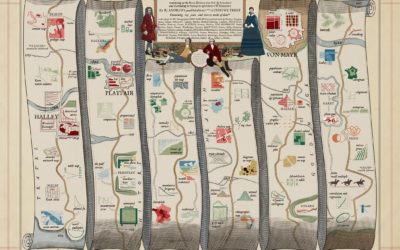
Mixing cartography and landscape drawing
Artist Matthew Rangel hikes cross-country and through the mountains, exploring and drawing along…
-
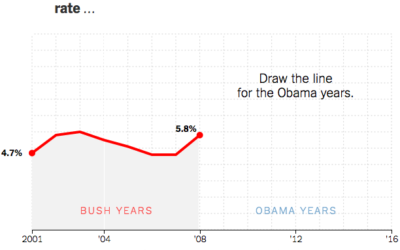
Draw the patterns of Obama’s presidency
A couple of years back The New York Times asked readers to draw…
-

Interview with Sesame Street’s Count von Count
Focusing on immigrant characters in television shows, The Guardian US’s data editor Mona…
-
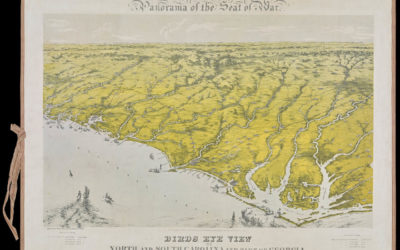
History of data visualization
I have an affinity for new things designed as old things, so this…
-
Balloon maps
There was a time when the best way to get a view from…
-

National Geographic Infographics, the book
Infographics devolved a bit in recent years, but there was a time the…
-
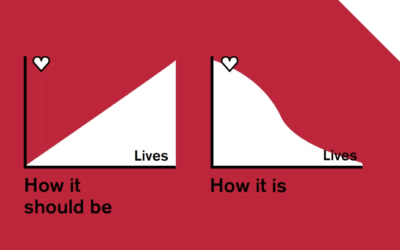
Data with the feels
Data can be fact and analytical. It can help you make objective decisions.…
-
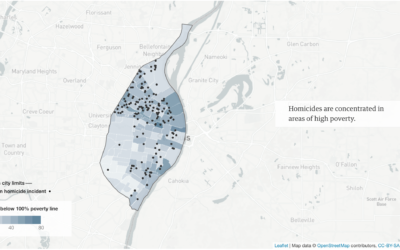
Going local on gun violence
Sometimes data can look really noisy when you zoom in close, and so…
-
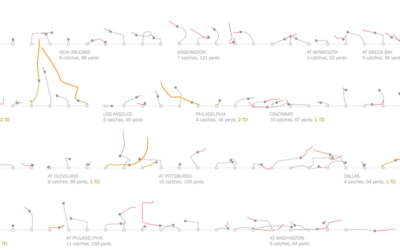
Football catches visualized
It’s always fun to go back to sports articles and graphics that were…
-
Members Only
How to Make an Animated Map in R, Part 4
In the the last part of the four-part series, you make a longer animation with more data and annotate.
-
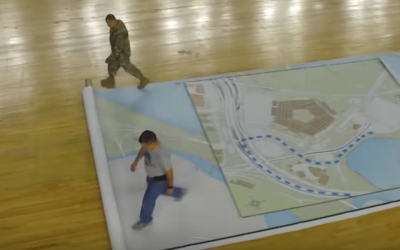
Giant map for inauguration planning
In planning for the upcoming inauguration, the U.S. military is using a giant…
-
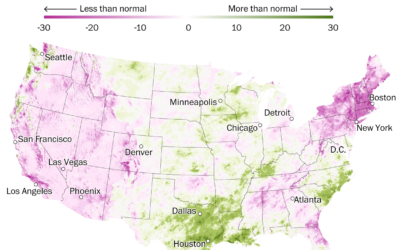
Change in rain, 2016
In some areas of the United States it poured down rain, which caused…
-
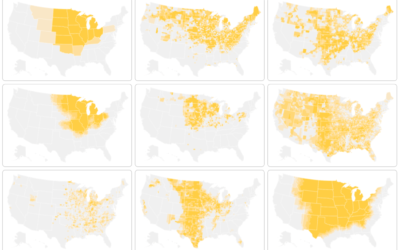
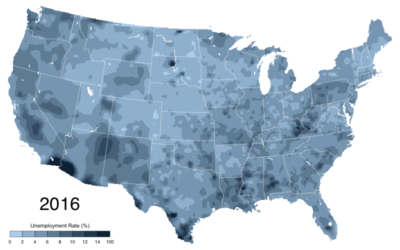
Looking for America’s heartland
By definition, heartland is some central place of importance of a country. But…
-
Charting friend demographics over time
We tend to think of demographics on a large scale. Countries, counties, and…
Recently for Members
Second Edition
 Visualize This: The FlowingData Guide to Design, Visualization, and Statistics (2nd Edition)
 Visualize This: The FlowingData Guide to Design, Visualization, and Statistics (2nd Edition)
New tools, refined process.
Browse by Chart Type See All →


