I’ve been teaching my three-year-old son how to ride his bike on two wheels. When I first took off the training wheels, he quickly lost his balance and felt discouraged. He thought he would be able to ride far and fast right away. He felt stuck, and gaining the skill to ride seemed out of reach.
I told him it was okay to fall. I used to fall all of the time, and sometimes I still do.
I said, “Falling is learning.”
He asked incredulously, “You fall?”
“Yep. It’s normal. That’s how you learn.”
“Okay.” He hopped back on his bike with his eyes on the path. “I’m going to try again.”
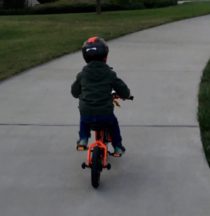 He can ride now. He rides farther every time we take the bike out, and I’m starting to lose my breath running alongside. He still falls, but every time he hops up and reassures me, “It’s okay. Falling is learning.”
This is how I approach programming for visualization.
I’m not great with code. I don’t know the best way to do everything. I just try to get things to work the best I can. I debug a lot. Especially in the beginning, when learning any new language, package, or framework, nothing seems to work, but eventually it does.
Visualization beginners get stuck here. Is this the right language? Is there a better way to do this? The key is to fight off these questions in your head early on. The great thing about visualization is that you get instant, visual feedback and your wonderments will answer themselves.
If the chart is wrong, then yeah, there probably is a better way to make it. Debug. Adjust. No big deal. You learn to avoid the mistake next time.
You will fall a lot, especially in the beginning. But that is okay. That means you’re learning.

 Visualize This: The FlowingData Guide to Design, Visualization, and Statistics (2nd Edition)


