In the department of tedious and thorough, Reddit user _tsweezy_ tracked every hour…
Self-surveillance
Insight to change our own behaviors.
-
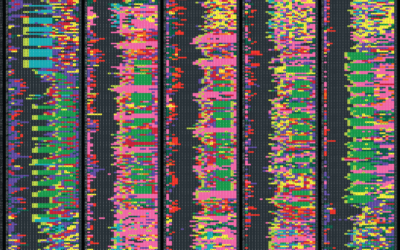
Every hour tracked, for five years
-
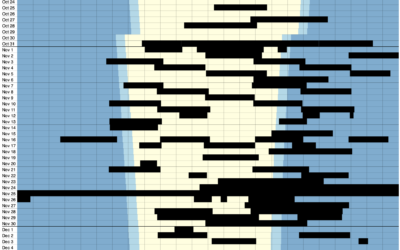
One home’s blackouts in Kyiv
Volodymyr Agafonkin and his family live in Kyiv, Ukraine. He visualized when the…
-
Luxury surveillance
Chris Gilliard, for The Atlantic, describes self-surveillance that people pay for in exchange…
-
Personal life dashboard
Felix Krause tracks many metrics of his life, both manually and passively, and…
-
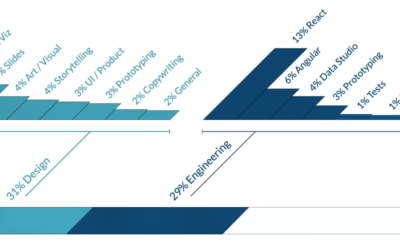
Time splits from a visualization freelancer
Eli Holder shows how he split his freelance time across various projects and…
-
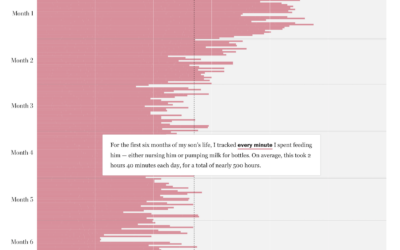
Cost of breastfeeding, seen in self-tracked data
There are baby formula shortages in the United States. A criticism from some…
-

Noah Kalina’s averaged face over 7,777 days
Noah Kalina has been taking a picture of himself every day since January…
-
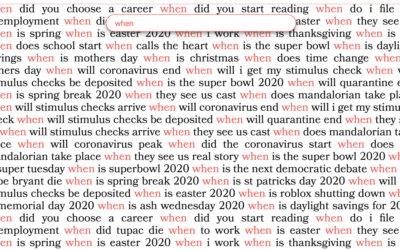
Exploring your Google search history
Search history can say a lot of about a person, like where they’re…
-
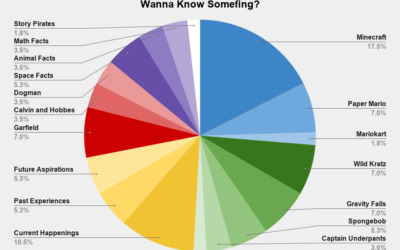
Wanna know somefing?
From Reddit user wequiock_falls, “What I’m about to learn about after my kid…
-

Cycling and mapping all the streets in London
Davis Vilums set a goal to cycle every street in London on his…
-

Man takes picture of himself every day for 20 years
In 2007, Noah Kalina posted a time-lapse video showing a picture of himself…
-
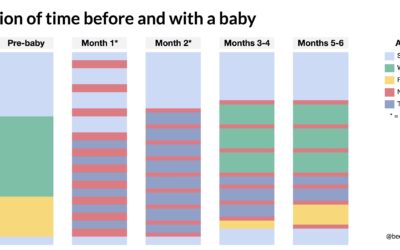
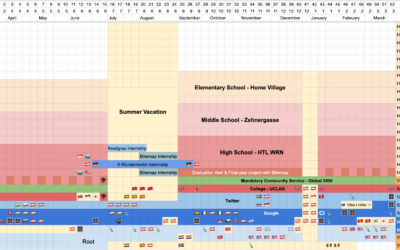
Schedule change with a baby
It’s difficult to emphasize how much life changes when a child comes into…
-
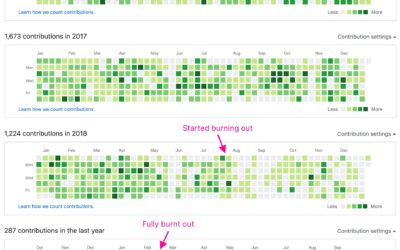
GitHub contribution graph to show burnout
A quick annotation by Jonnie Hallman on Twitter: “GitHub is really good at…
-
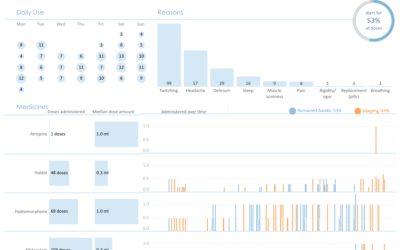
With terminal cancer, a patient tracks drug dose in a dashboard over her final days
Kelly Martin died of cancer on September 30. She was able to enjoy…
-
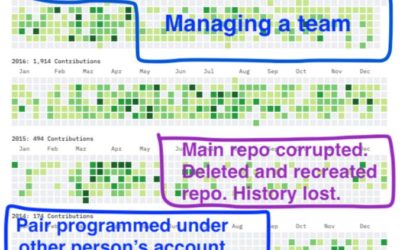
GitHub is meant to track code
Jen Luker noted, “As amazing as @github is, it is a tool designed…
-
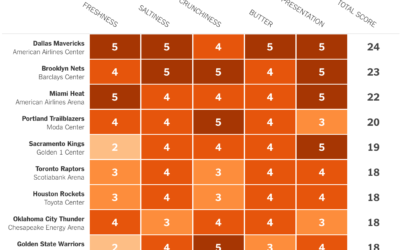
Stephen Curry scores every arena’s popcorn
I marked this article for later reading. It’s about Stephen Curry’s love of…
-
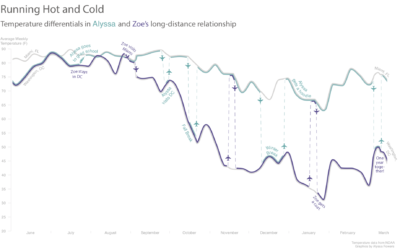
A long distance relationship between a temperature difference
Everyone’s story is a little different. Alyssa Fowers tracked her long-distance relationship in…
-
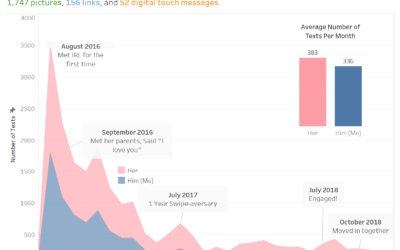
Texting history after the first swipe
Speaking of relationship timelines, Chris Lewis used texting history with his girlfriend after…
-
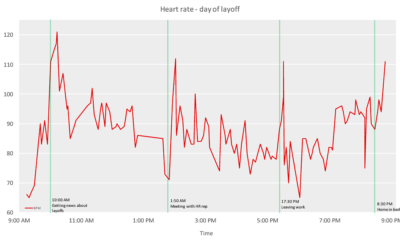
Heart rate during layoff
Add another chart to the genre of heart rate during a significant event.…
-
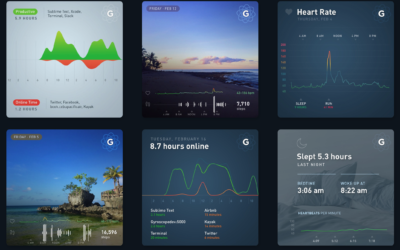
Gyroscope to automatically track your health data
I’m surprised I’m just now hearing about Gyroscope. It’s an app that automatically…
Recently for Members
Second Edition
 Visualize This: The FlowingData Guide to Design, Visualization, and Statistics (2nd Edition)
 Visualize This: The FlowingData Guide to Design, Visualization, and Statistics (2nd Edition)
New tools, refined process.
Browse by Chart Type See All →


