• Membership
  • Newsletter
  • Projects
  • Learning
  • About
  • Member Login
  • More gender-neutral names

    April 8, 2022

    Topic

    Statistical Visualization  /  gender, Georgios Karamanis, names

    Georgios Karamanis plotted the ratio of girls-to-boys over time for all the names in the Social Security Administration dataset. You can see the more gender-specific names at the edges and more gender-neutral names clustering in the middle.

    Those dips in 1989 and 2004 are curious. Otherwise, the increase in gender-neutral names seems to match up with my analysis from a while back.

  • Members Only

    Overlapping Lines

    April 7, 2022

    Topic

    The Process  /  overlapping

    More lines can mean more patterns, more cycles, and more context.

  • Working the triple peak

    April 7, 2022

    Topic

    Statistical Visualization  /  keystrokes, Microsoft, work

    Microsoft researchers analyzed keystrokes by time of day, for a sample of Microsoft employees during this past summer. You can see the typical peaks during work hours with a dip for lunch. But among 30% of workers in the sample, there was a third peak starting around 9 o’clock in the evening.

    That third peak felt too close to home for me.

  • Oscar outfits as public health graphs

    April 6, 2022

    Topic

    Statistical Visualization  /  clothes, humor, Oscars, William Lopez

    The 2022 Oscars came and went, and it was like all anyone could talk about was how outfits paired with public health charts. William Lopez has the collection.

  • Lessons learned from making covid dashboards

    April 6, 2022

    Topic

    Statistics  /  coronavirus, dashboard, nature

    For Nature, Lynne Peeples spoke to the people behind many of the popular covid dashboards and the lessons learned:

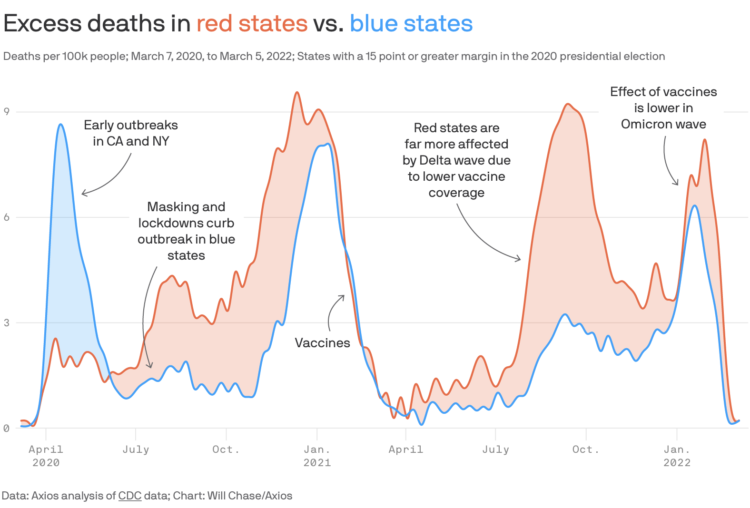
    Among the shared themes for the dashboards were simplicity and clarity. Whether you are producing visuals and analytical tools for policymakers or for the public, Blauer says, the same rules of thumb apply. “Don’t overcomplicate your visualization, make the conclusions as clear as possible, and speak in the most basic of plain-language terms,” she says.

    Yet, as other data scientists point out, presenting data simply might not be enough to ensure viewers get the message. For one thing, attention to detail matters. Ritchie recalls how she and her team spent hours focused on the titles and subtitles of charts, “because that is ultimately what most people will look at”. And in those titles and subtitles, the analysts made sure to specify ‘confirmed’ deaths or ‘confirmed’ cases. “An emphasis on ‘confirmed’ is really important because we know that it’s an underestimate of the total,” says Ritchie. “It might seem very basic, but it’s really crucial to how you understand the data and the scale of the pandemic.”

  • Ukraine’s defense in Kyiv

    April 5, 2022

    Topic

    Maps  /  defense, Kyiv, New York Times, Russia, Ukraine, war

    The New York Times shows how Russia has tried to take over and how Ukraine continues to stop the offensives. The mixed media piece pulls you in to how different strategies have worked and have not, at least the best you can through a screen.

  • Data Underload  /  literacy

    Literacy Scores by Country, in Reading, Math, and Science

    Among 15-year-old students, here’s how 77 countries compare in reading, math, and science. Higher scores are better.

    Read More
  • 1950 Census released by U.S. National Archives

    April 1, 2022

    Topic

    Data Sources  /  archive, census, history

    For privacy reasons, there’s a 72-year restriction on individual Census records, which include names and addresses. It’s 72 years today since the release of the 1950 Census. The scanned paper records are available for browsing and downloading.

  • Russia’s logistics problems

    April 1, 2022

    Topic

    Infographics  /  logistics, Russia, war, Washington Post

    For The Washington Post, Bonnie Berkowitz and Artur Galocha report on several facets of Russia’s logistics, from poor protection, to poor communication, to vehicle breakdowns.

  • Members Only

    Visualization Tools and Learning Resources, March 2022 Roundup

    March 31, 2022

    Topic

    The Process  /  roundup

    Here’s the good stuff for March.

  • Climate spiral to show temperature change

    March 31, 2022

    Topic

    Statistical Visualization  /  Ed Hawkins, NASA, temperature

    Say what you will about circular visualization, but the spiral plays. This one from NASA shows global temperature change over time:

    The visualization presents monthly global temperature anomalies between the years 1880-2021. These temperatures are based on the GISS Surface Temperature Analysis (GISTEMP v4), an estimate of global surface temperature change. Anomalies are defined relative to a base period of 1951-1980. The data file used to create this visualization can be accessed here.

    This is based on Ed Hawkins’ chart originally from 2016, but watch to the end for some extra sauce.

  • Defining color palettes for all your charts

    March 30, 2022

    Topic

    Design  /  color, Datawrapper, Lisa Charlotte Muth, style guide

    Selecting a color palette for a single chart can be tricky, which is why we see so many charts that just go with defaults. Selecting a color palette for all your charts is a bigger challenge. For Datawrapper, Lisa Charlotte Muth has you covered with a detailed guide that describes the important bits, existing color palettes in the wild, and consideration for your readers.

    You’ll want to save this for later. It just stops short of picking the colors for you.

  • Most people think their employers don’t care about their well-being

    March 30, 2022

    Topic

    Statistical Visualization  /  Gallup, pandemic, well-being, work

    Based on polls by Gallup, almost half of U.S. employees thought their employers cared about their well-being early on in the pandemic. That sentiment did not last:

    Fewer than one in four U.S. employees feel strongly that their organization cares about their wellbeing — the lowest percentage in nearly a decade.

    This finding has significant implications, as work and life have never been more blended and employee wellbeing matters more than ever– to employees and the resiliency of organizations. The discovery is based on a random sample of 15,001 full and part-time U.S. employees who were surveyed in February 2022.

    Maybe this is just life’s way of saying it’s healing.

  • Potential coronavirus mutations

    March 29, 2022

    Topic

    Infographics  /  amino acids, coronavirus, mutation, New York Times

    For NYT Opinion, researchers Sarah Cobey, Jesse Bloom, and Tyler Starr, along with NYT graphics editor Nathaniel Lash, discuss the potential mutations for the coronavirus. The accompanying graphic zooms in on the amino acids that allow the virus infect human cells. Scroll to see the mutations in the Delta variant and Omicron, and then keep going to see where else we might be headed.

  • Charting all the vehicles of James Bond

    March 28, 2022

    Topic

    Infographics  /  Baryon Design, James Bond, vehicles

    Baryon Design collated data for all the vehicles James Bond used across all 25 films. You can see every vehicle used, categorized by type and displayed by time of use.

  • Intercepted Russian radio communications

    March 25, 2022

    Topic

    Infographics  /  New York Times, radio, Russia, war

    The New York Times analyzed Russian radio communications near Kyiv. The unencrypted transmissions, which anyone with a ham radio could record and even interject in, seem to suggest logistical mistakes early on.

    The mixed media piece, driven primarily by audio, adds another dimension to the wideout map views of the invasion.

  • Partisan excess deaths

    March 25, 2022

    Topic

    Statistical Visualization  /  Axios, coronavirus, partisanship

    Excess deaths is the difference between expected deaths based on historical data and actual total deaths. It’s an estimate for how many people really died from covid. For Axios, Will Chase and Caitlin Owens charted excess deaths for Republican-leaning states compared against Democratic-leaning states, between March 2020 and March 2022.

  • Members Only

    Double Check Twice, Edit Once – The Process 182

    March 24, 2022

    Topic

    The Process  /  editing, questions

    Be skeptical of your data in the beginning to save time in the end.

  • Pollution by the rich versus poor

    March 24, 2022

    Topic

    Maps  /  Bloomberg, climate, wealth

    Based on estimates from the World Inequality Lab, Bloomberg shows how wealthier individuals’ habits — not just countries’ activities — contribute more to overall carbon emissions.

    There’s a 3-D grid map with a square for each country. It transitions from the usual way of looking at national carbon emissions to carbon emissions from the wealthy who live everywhere. You can always count on Bloomberg to keep their graphics spicy.

  • Days since record-high temperatures

    March 24, 2022

    Topic

    Maps  /  climate, Pudding, temperature

    Here’s a fun/alarming weather map from The Pudding. Using data from the Applied Climate Information System, they show the number of days since a record-high temperature in hundreds of U.S. cities. The counters are in the style of those signs in factories that show days since the last injury.

  • Page 63 of 391
  • <
  • 1
  • ...
  • 60
  • 61
  • 62
  • 63
  • 64
  • 65
  • ...
  • 391
  • >

Analyze, visualize, and communicate data usefully, beyond the defaults.

Become a member →

Recently for Members

May 8, 2025
When the data is not what it seems

May 1, 2025
Finding the Right Charts

April 24, 2025
Visualization Tools, Datasets, and Resources – April 2025 Roundup

April 17, 2025
Breaking Out of Chart Software Defaults

April 15, 2025
Line Chart with Decorative Neon Accents

Browse by Chart Type See All →

Pie Chart Parallel Sets Density Plot Chord Diagram Pictogram Streamgraph Timeline Barcode Chart Heatmap Surface Plot

Browse By Topic

  • Visualization

    Seeing data

  • Maps

    Seeing geographic data

  • Infographics

    Explaining data

  • Networks

    Connecting data

  • Statistics

    Analyzing data

  • Software

    Working with data

  • Sources

    Getting data

  • Design

    Making data readable

Get the Book

Visualize This: The FlowingData Guide to Design, Visualization, and Statistics

Available now.

Order: Amazon / Bookshop

Made by FlowingData

  • The Process

  • Data Underload

  • Chart Everything

  • Guides

  • Books

  • Shop

  • About
  • Contact
  • Newsletter
  • LinkedIn
  • Instagram
  • Bluesky
  • RSS
Copyright © 2007-Present FlowingData. All rights reserved.