It’s coming to the end of the academic year, which means there are lots of graduate students frantically finishing up their dissertations, defending, and earning their degrees (yay!). Here are some tasty visualization dissertations, new and old, worth thumbing through.
Information Visualization for the People by Mike Danziger, Massachusetts Institute of Technology, Comparative Media Studies
The Form of Facts and Figures by Christian Behrens, Potsdam University of Applied Sciences, Interface Design
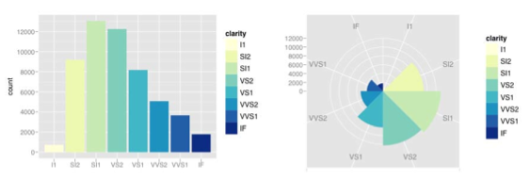
Practical Tools for Exploring Data and Models by Hadley Wickham, Iowa State University, Department of Statistics
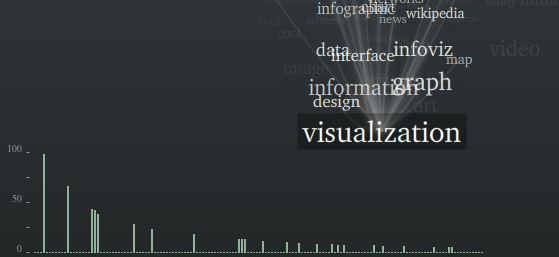
Visual Tools for the Socio–semantic Web by Moritz Stefaner, Potsdam University of Applied Sciences, Interface Design
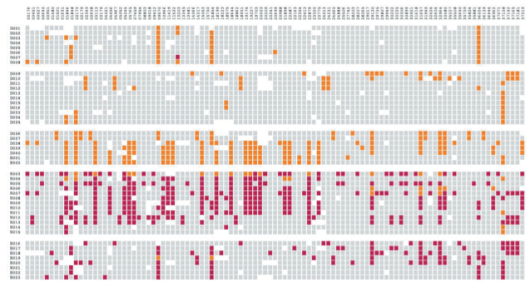
Computational Information Design by Ben Fry, Massachusetts Institute of Technology, Media Arts and Sciences


 The more people who flock a story, the higher up the flock list the story goes. In the sidebar of each story is an interactive graphic that shows readers flocking around the news and stories getting highlighted. The larger the bubble, the more people who have flocked it; story bubbles light up orange when someone flocks it. The site isn’t showing any larger sizes, but a full screen version could be fun. Maybe a screensaver.


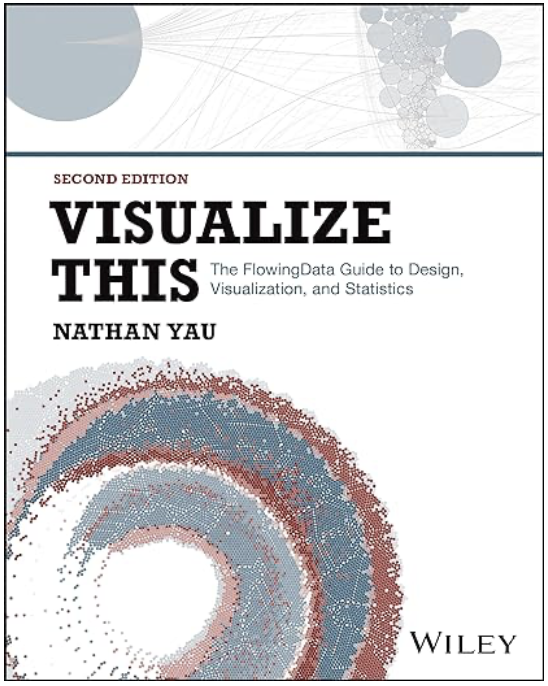 Visualize This: The FlowingData Guide to Design, Visualization, and Statistics (2nd Edition)