This week is about helping data stand out in the land of many points.
This week is about helping data stand out in the land of many points.
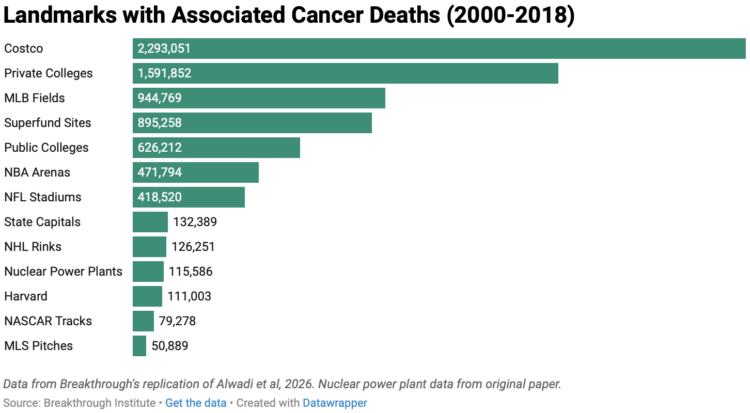
Harvard researchers published an analysis arguing that risk of cancer increases when people live closer to nuclear power plants. Deric Tilson and Adam Stein, of the Breakthrough Institute, disagree with the study, so they replicated it. They show that using the Harvard methodology, results suggest any physical landmark will lead to increased cancer risk.
Costco, with its “reasonably priced clothes”, topped the list, which seems like an incorrect conclusion to draw from the data. How dare they.
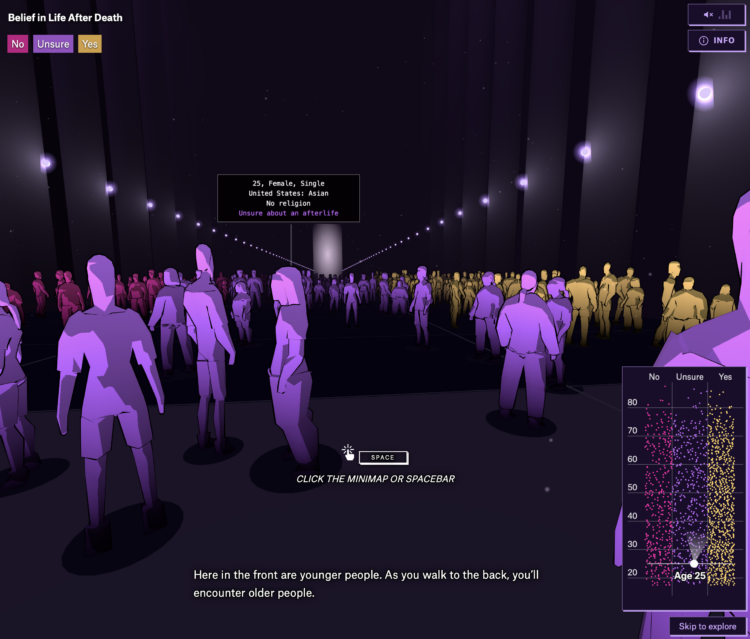
Is there something that comes after we die? For the Pudding, Alvin Chang imagined what it would be like if you walked into a room and could see everyone’s answer. A dot plot provides a map of where people stand, by age and their responses. You walk and scroll through the crowd along the axes and towards the light while music and narration provide depth to the data.
I like how Chang keeps the abstract connected to reality. It is a recurring theme, like in previous work on loneliness, teenage adversity, and relationships. Zoom out to see the patterns and zoom in to see individual survey responses.
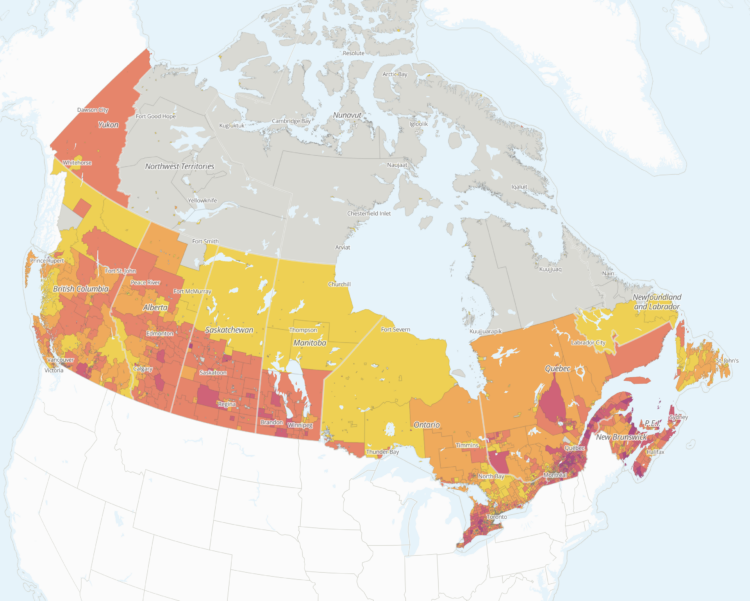
Researchers at the School of Cities, a center at the University of Toronto, are studying the impact of U.S. tariffs in Canada.
Since May 2025, Tara Vinodrai and Karen Chapple have led a team of researchers at the School of Cities to develop interactive mapping and visualization tools that measure and explore the potential impacts of tariffs on jobs and businesses across Canadian cities and communities at the neighbourhood and city level. Our tools illustrate the highly localized and uneven potential impacts of U.S. tariffs reflecting Canada’s underlying urban, regional and sectoral specializations.
An interactive map shows potential exposure. The above shows estimates as of the end of September 2026, which have high uncertainty, because they are dependent on the variable choices of the U.S. president.
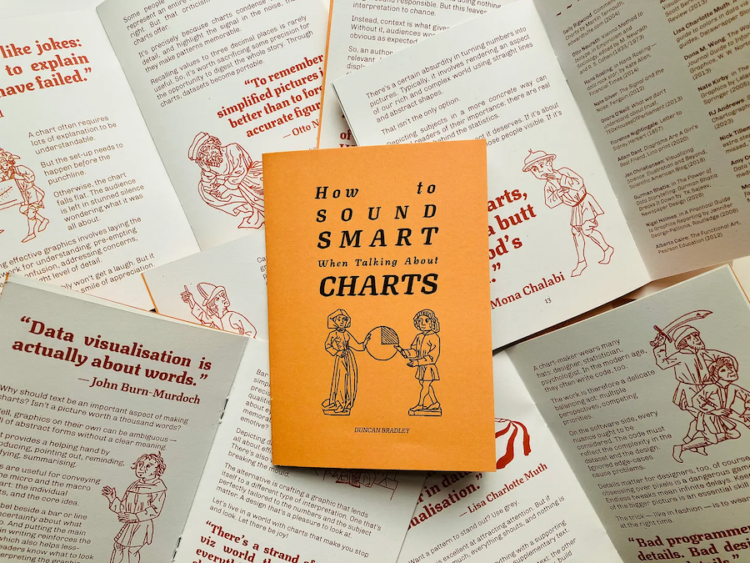
Duncan Bradley made a zine of one-liners from data visualization folks. It is called “How to Sound Smart When Talking About Charts.”
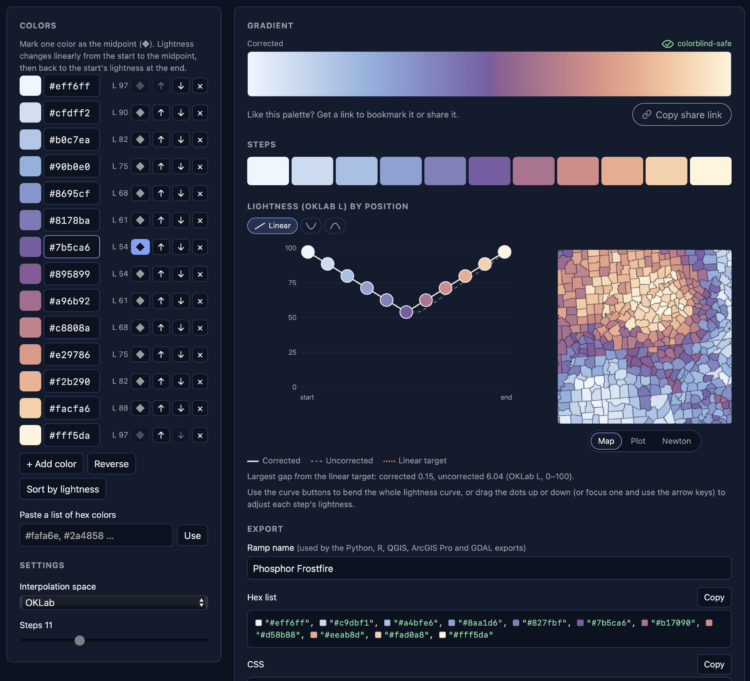
It has been a whole ten minutes since posting a color selection tool, so here is another. Phosphor by Joshua Stevens lets you enter hex colors and get a gradient with the gaps filled in between. Made with chroma.js, there are some familiar options, such as color space and color deficiency previews.
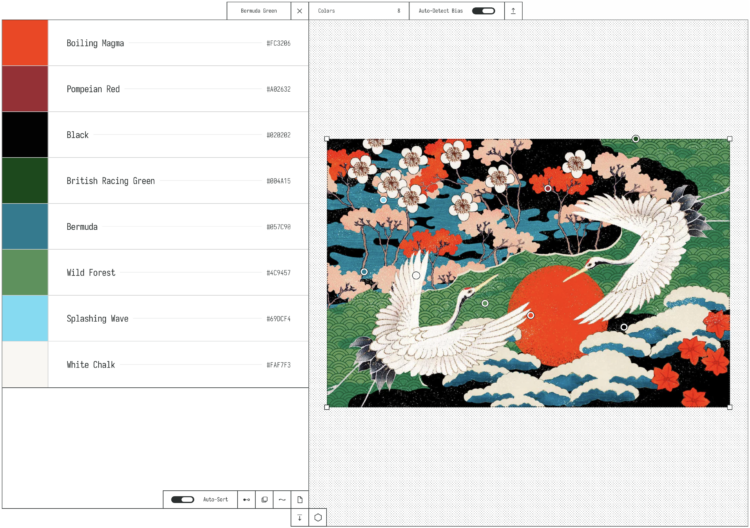
OKpalette is a tool to grab a color palette from an image. Load the image in the browser, set the number of colors, and define a region in the image and you get a collection of shades. Images stay on your computer and the color picking is in-browser. Nifty.
There will never be enough color-picking tools.
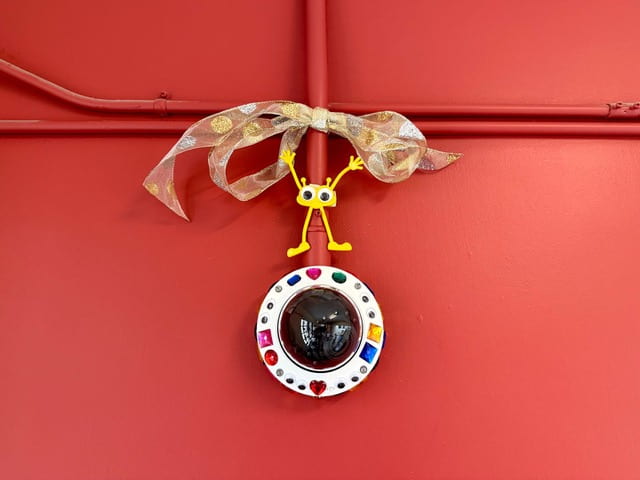
Over summer break, MIT installed over 500 AI-enabled surveillance cameras around campus. In an act of defiance celebration, professors started a group to bedazzle the cameras.
That said, if any students, staff, or faculty still have pesky concerns about this unprecedented ratcheting-up of campus surveillance, now you know that there’s a committee to contact with complaints. Or, you could join us, the cheerful bedazzlers, by celebrating the beauty of our beholdenness to Big Brother Tech. Do you feel proud to be involved in the capitalist project of improving Ambient.ai’s services and enriching surveillance for all people, everywhere? Do you patriotically embrace the fact that Ambient.ai shares the data they collect with government and law enforcement when they receive subpoenas, without needing to ask or tell the institutions from whom they collected it? If so, there are hundreds of white plastic eyelids out there awaiting artistic adornment to enhance their visibility even as they enhance ours!
In sum, we thank our glorious administration for their brilliant technical solution to a social problem. This is how it should be, because all social and political problems definitely have a technical solution, and usually we just need to pay for something involving AI rather than have an open discussion as a community (what a waste of time that would be!).
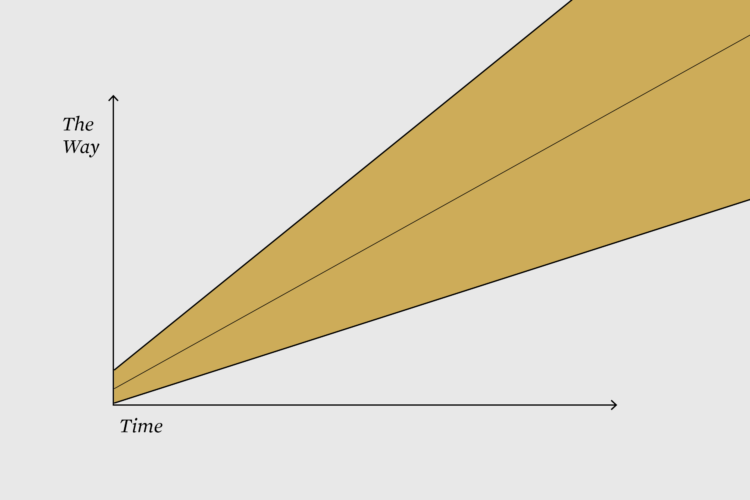
This week is about finding your way by getting lost in the data.
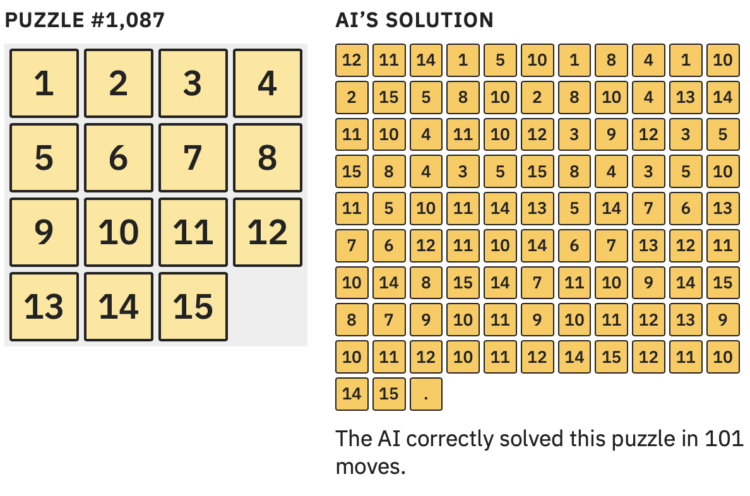
Large language models are heavily dependent on training data to determine what comes next in a series of choices. So when there is limited data for a given situation, the choices grow more uncertain. However, as Aatish Bhatia explains, this can lead to output that is “confidently wrong” instead of a highlighting random guesses.
Bhatia uses a puzzle (that you can play) to demonstrate training, processing, and the guesswork that brings you to the jagged boundary of a model’s accuracy. The boundary is surprisingly at the beginner level.
For NYT Opinion, Giorgia Lupi argues that the best ideas come from getting lost:
The same is true for a great recipe, a great story or even a thoughtful PowerPoint presentation. A.I. may be (mostly) accurate, but it’s not considerate. The greatest contributions to humanity — art, inventions, even products — show evidence of people who got lost in a problem and came out the other side with an idea they would not have found otherwise. That does not happen by taking a shortcut to the center. It happens in the detours.
AI promotes skipping to the answer, which is useful when the problem is well-defined and the solution is concrete. But even then, you’re missing out on the in between.
Christoph Niemann shared a similar sentiment last year with art: “Automating the creation of art is like automating life, so you can make it to the finish line faster.” Terence Tao said similar with mathematics.
Lupi, Niemann, and Tao all use generative AI tools in their process. Just not for the ideas and pathfinding.

Jane Wickline impersonated Anthropic CEO Dario Amodei for Saturday Night Live’s Weekend Update.
Read More
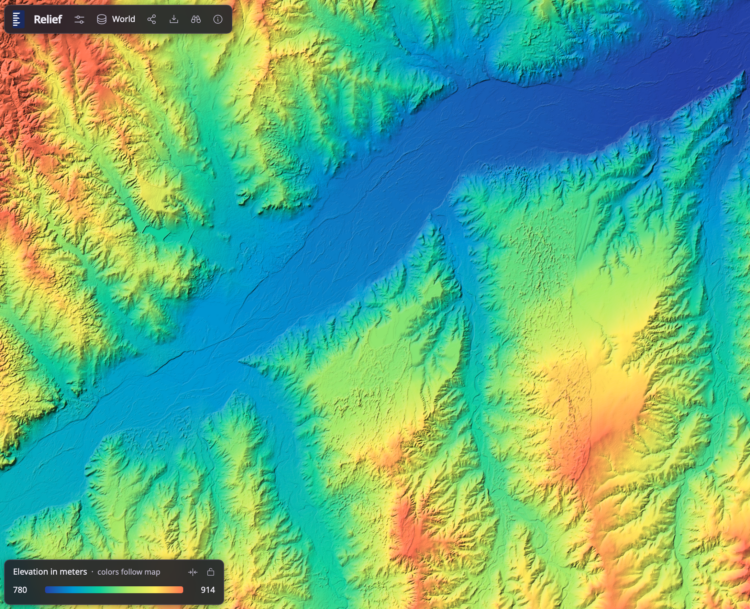
Bert Spaan, with help from Jules Schoonman, made an elevation map for the world, based on data from Actueel Hoogtebestand Nederland (AHN). The nice feature of this interactive map is that the color scale adapts dynamically by the area you are looking at.
I’m not sure about the rainbow color scheme, as there are alternatives that are contextual and easier to see, but to each his own. It’s fun to check out the details as you pan and zoom.
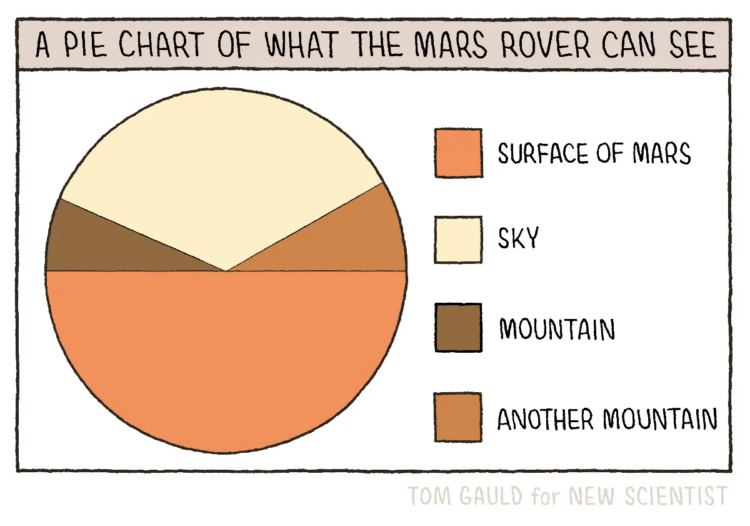
New to me, Tom Gauld, for New Scientist, made a fine pie chart to show what the Mars rover can see while on the surface of the Red Planet.
This is up there with the pie chart pyramid and eaten pie.
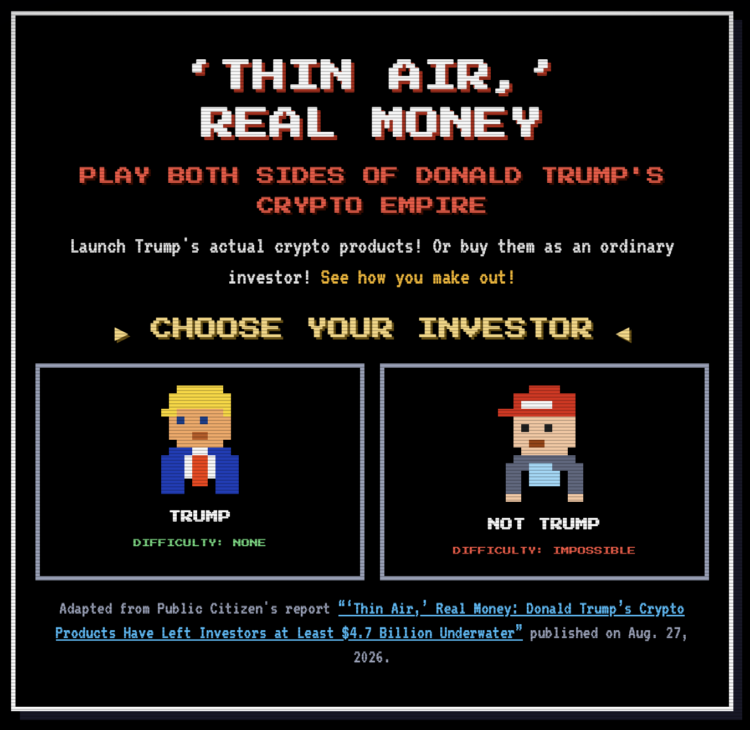
Thin Air, Real Money is a game to help you understand the cryptocurrency schemes from Trump. Experience the millions in gains as the president or the losses as not the president.
The title is based on Trump’s tweet from 2019:
I am not a fan of Bitcoin and other Cryptocurrencies, which are not money, and whose value is highly volatile and based on thin air. Unregulated Crypto Assets can facilitate unlawful behavior, including drug trade and other illegal activity….
That opinion has since switched.
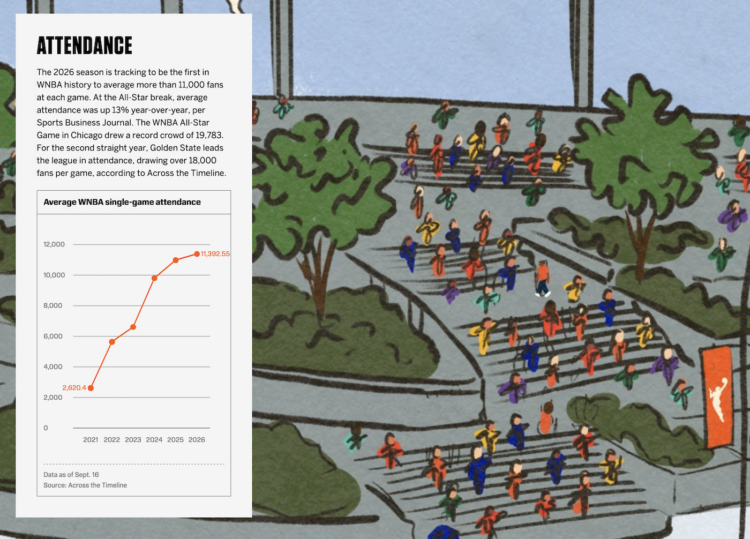
Celebrating 30 seasons of the WNBA, ESPN has a fun piece on the history of the league and how it has grown. I like the tour of the illustration as the charts go by.
Here’s what happened in September.
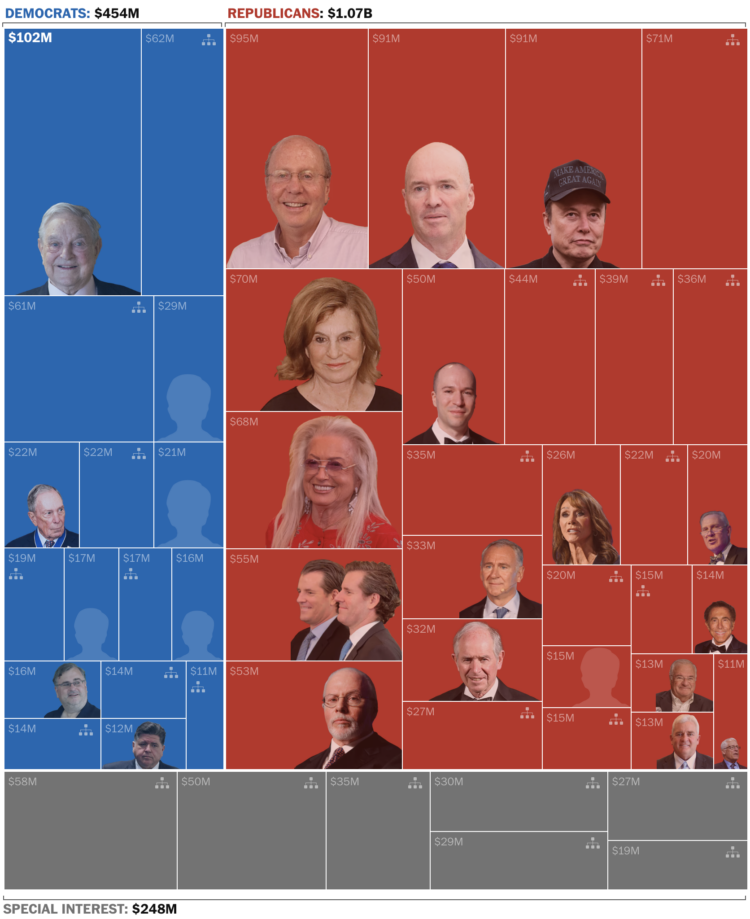
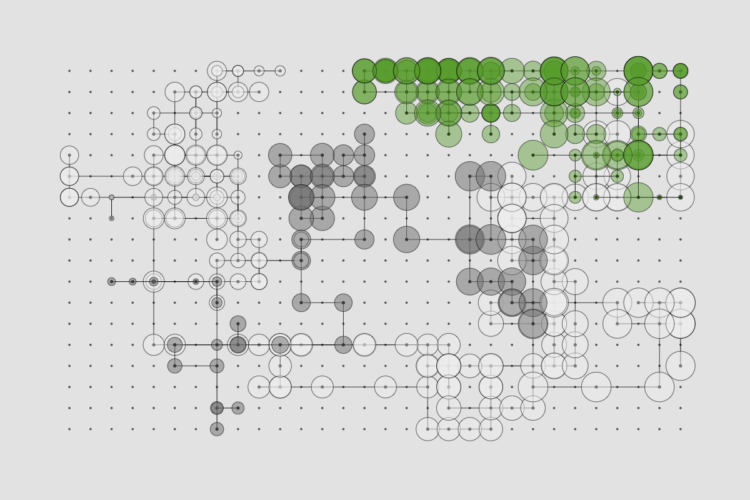
Using data from the Federal Election Commission, the Washington Post called out the fifty biggest donors in 2026 and categorized them by the parties they donated to. The gray rectangles are donations from organizations, which happen to be related to cryptocurrency, gambling, AI, and guns. Together, this small group of donors have donated $1.7 billion.
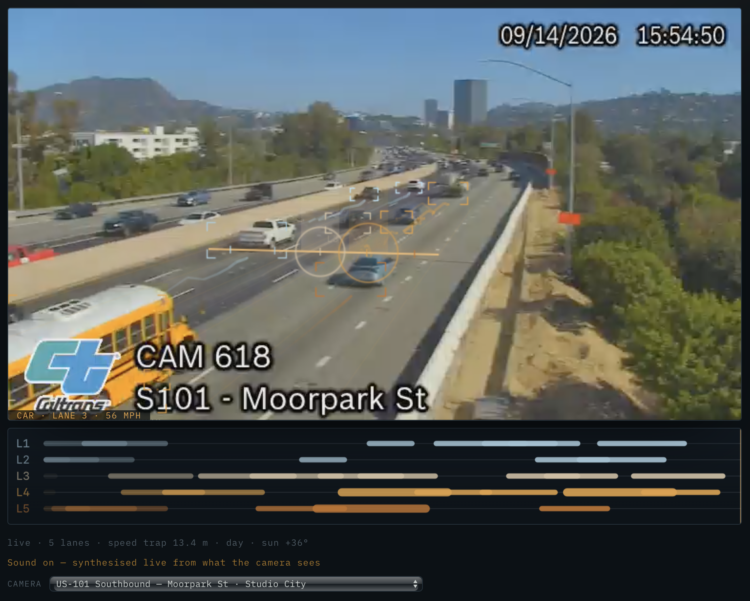
A live Caltrans feed of the southbound 101 highway in California is translated to music-ish tones. Each vehicle that passes is a note. Select the instruments you want.
It doesn’t compare to actual composition, but the live aspect is interesting. You might want to view it on a computer that is younger than a decade, as mine buckled under the pressure.
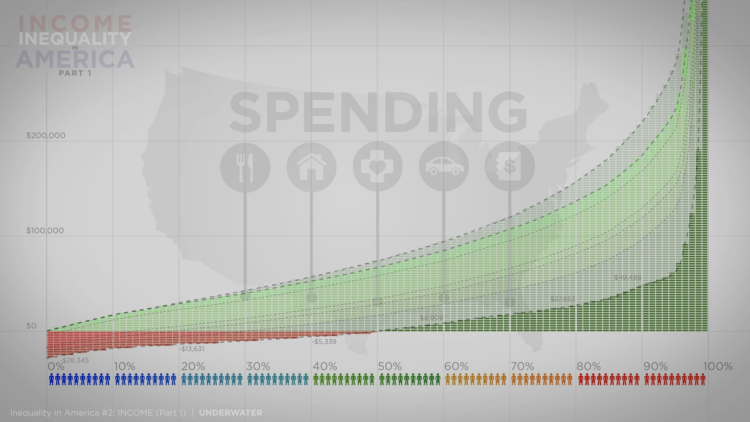
Continuing the four-part series on wealth inequality in America, the most recent video from Politizane explains the point of view from income and spending.
Read More
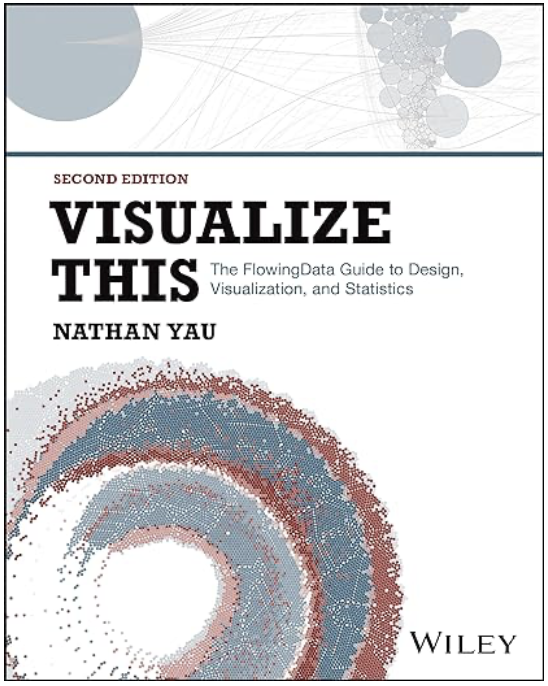 Visualize This: The FlowingData Guide to Design, Visualization, and Statistics (2nd Edition)
New tools, refined process.