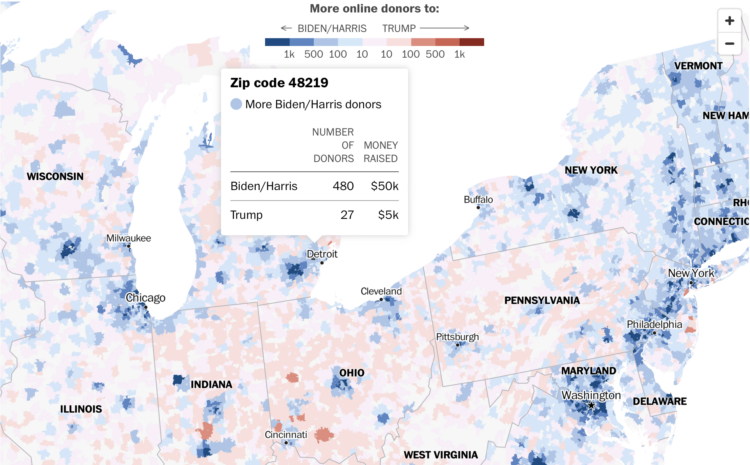
Using a combination of Federal Election Commission filings and voter registration, the Washington Post shows which presidential campaign has received more money from donors from each ZIP code. It’s only online donations, so it’s just a subset of where the money is coming from, but I imagine offline donations are tightly correlated.
-
Members Only
-
For NYT Opinion, Patrick Ruffini, with graphics by Quoctrung Bui and Aileen Clarke, argues that the election outcome is less about swing states and more about pockets within each state:
The best way to tell how a state will vote is to build from the precinct level up, to dig into neighborhood data and to look at the differences in demographics and voting patterns across those precincts. Using this approach, I assembled more than 100 political microcommunities in the battleground states.
-
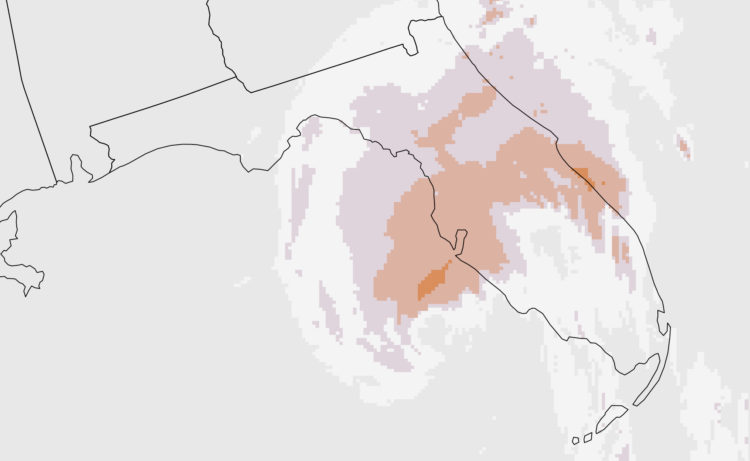
Make the Chart: Precipitation Map as Animated GIF
Weather. Data. Map. Animation. They go well together to show sudden changes over time.
-
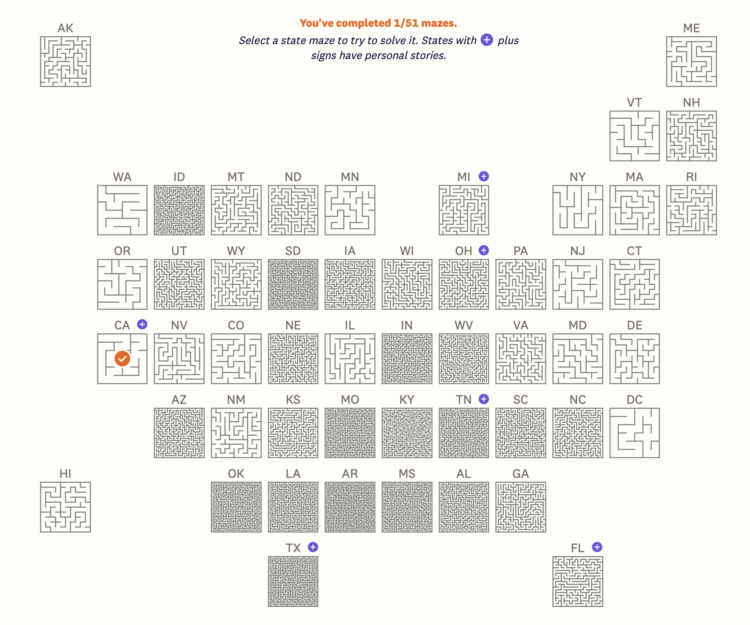
Speaking of grid maps and abortion access, Jan Diehm and Michelle Pera-McGhee, for The Pudding, estimated a complexity score (with variables from the Guttmacher Institute) for each state and made mazes to match the scores. Mazes are organized as a state grid map initially, but you can also sort by complexity, alphabetically, or by region.
-
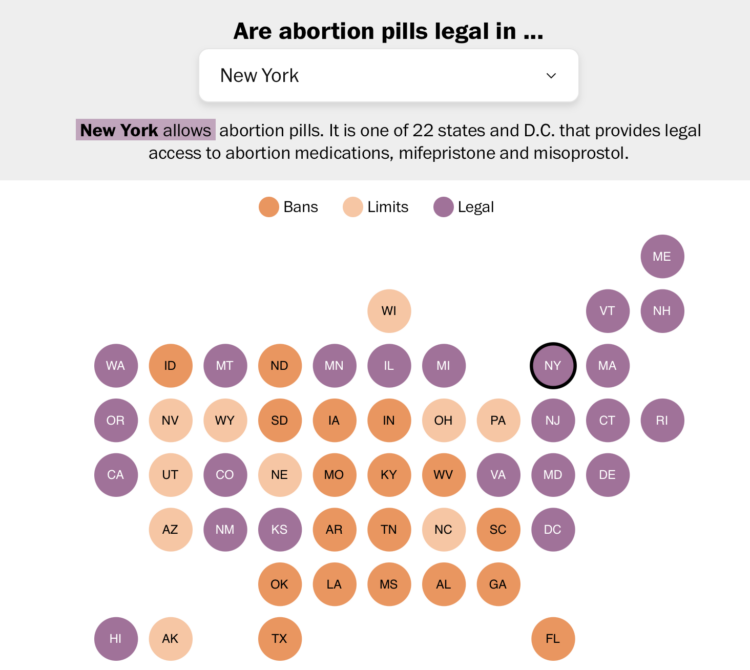
For the Washington Post, N. Kirkpatrick and Szu Yu Chen describe the legality of abortion pills in each state. There’s a grid map with a dropdown to select each state. I like the short summary sentence that updates with each selection. It makes the legality in your selected state obvious.
-
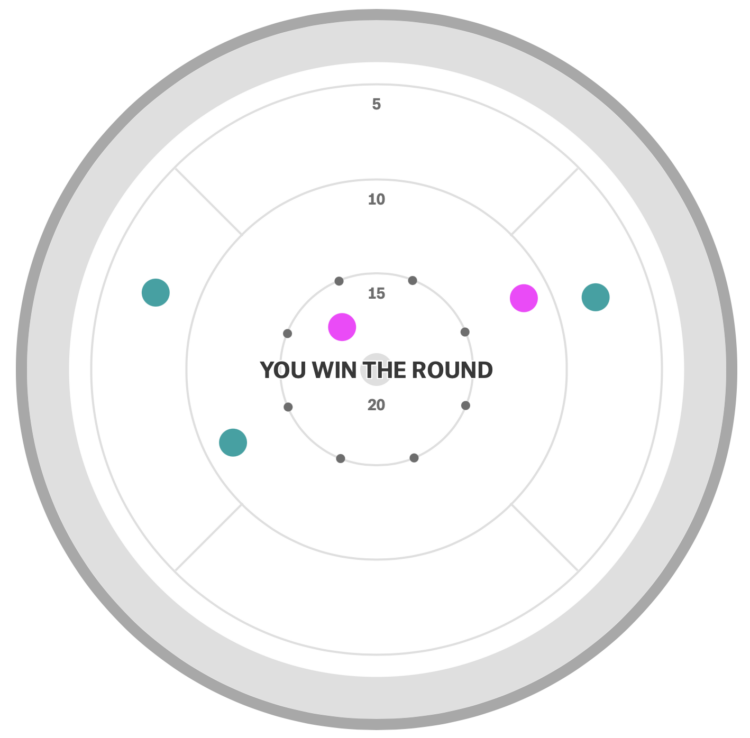
From Russell Samora for The Pudding, “Crokinole is like a mashup of shuffleboard and curling, played on a tabletop board.” There is even a playable simulation that you can practice on. I need to get myself a Crokinole board.
-
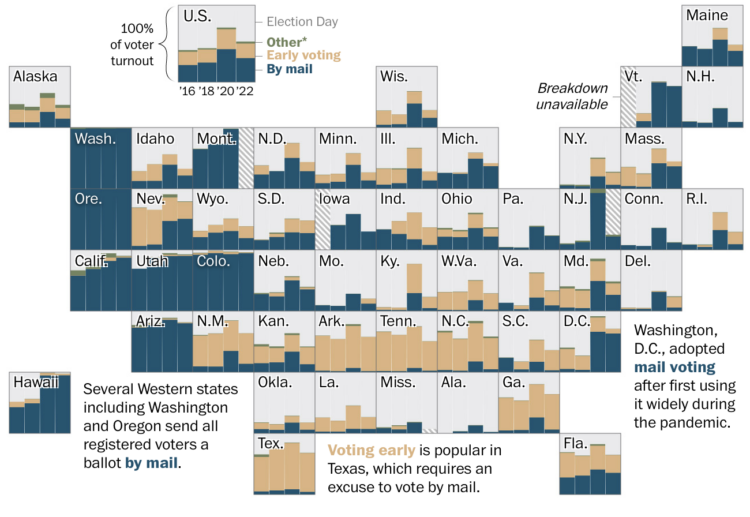
Some states have almost completely moved to voting by mail or early voting, whereas other states mostly vote in person on election day. For the Washington Post, Nick Mourtoupalas used a grid map to show how voting method changed each election since 2016.
Here in California, I voted by mail the last election, but I had no idea the percentages were that high. I’m also surprised by the high rates of early voting.
The estimates are based on data from the Election Administration and Voting Survey, which has run every two years since 2004.
-
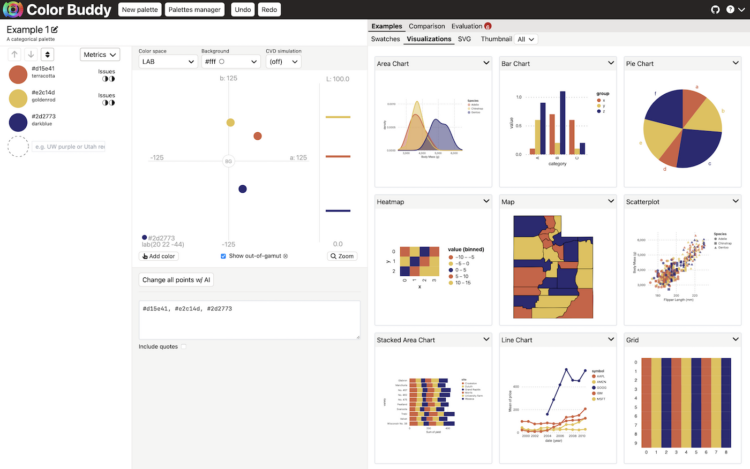
Picking colors for visualization can be tricky, because there are infinite possibilities across the color spectrums. Often you’ll want to adjust hue, saturation, and lightness separately or together. Then you need to know what it actually looks like with your charts. Color Buddy might be the tool you need.
The goal of Color Buddy is to help you make excellent color palettes for data visualization via a direct manipulation environment that evaluates your color palettes as you go.
You might think that there are enough color-picking tools for visualization, but you’re wrong. There’s never enough and there never will be.
-
Damage assessments from UNOSAT estimate that 66% of structures in Gaza are damaged as of September 6, 2024, of which 78% are moderately to severely damaged or destroyed. This is about 128,000 buildings. For scale, Reuters compared the count to all the buildings in Manhattan.
-
Members Only
-
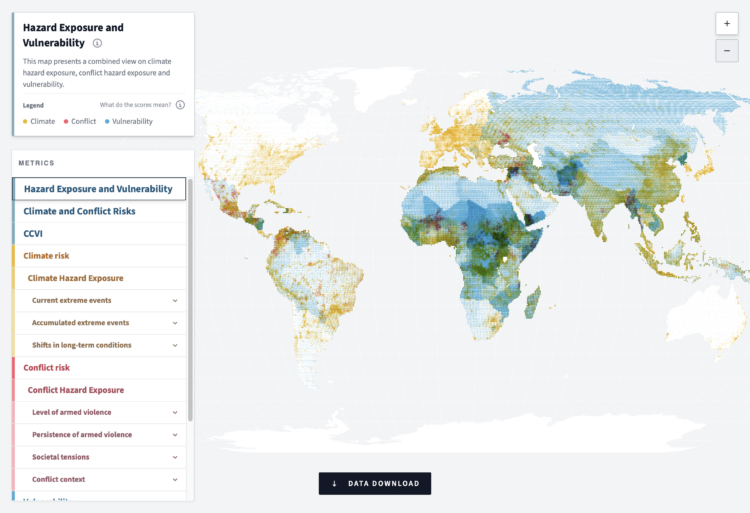
In an effort to measure and highlight risks globally, the German Federal Foreign Office released the Climate-Conflict-Vulnerability Index. It shows the risks of climate change, such as drought, floods, and wildfire. It shows conflict, such as armed violence and societal tensions. It shows vulnerability, such as gender inequality, food insecurity, and soil degradation.
An interactive map lets you see all the parts together or separately. It’s a lot of variables to take in at once, but the tool helps you sift to get a feel for risks everywhere. You can also download data quarterly or the full historical time series to analyze and visualize yourself.
-
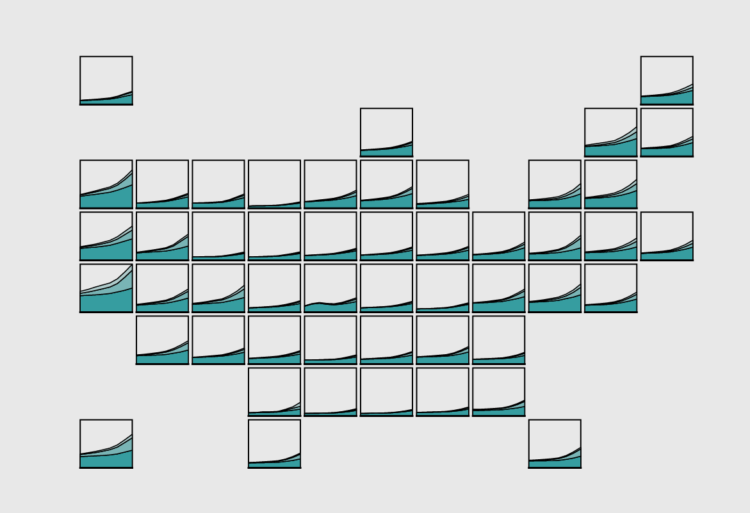
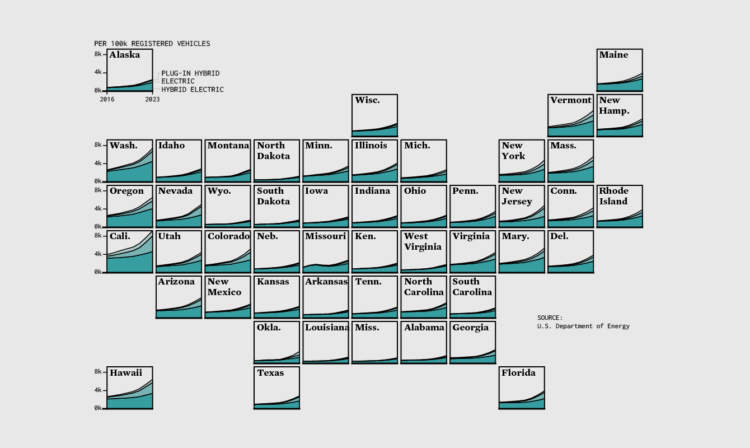
About 4% of registered light-duty vehicles in the United States are either electric, hybrid electric, or plug-in hybrid, as of 2023. That’s more than double than in 2016. However, electric adoption isn’t consistent across the country.
-
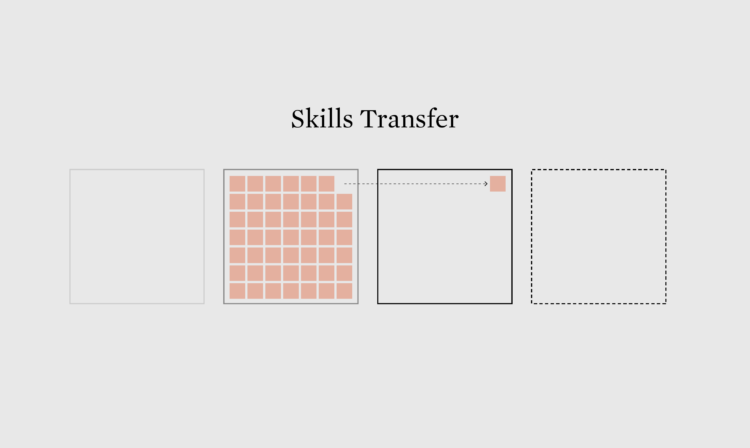
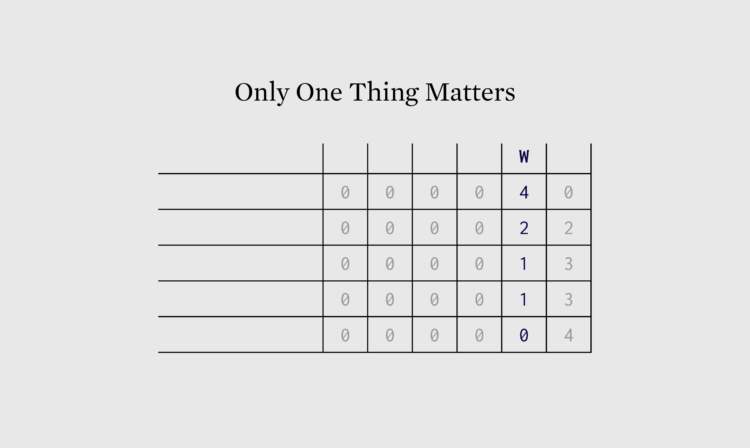
Make the Chart: Grid Map with Stacked Areas
Breaking it down to the small steps and choices with data, code, and editing that lead to a finished chart.
-
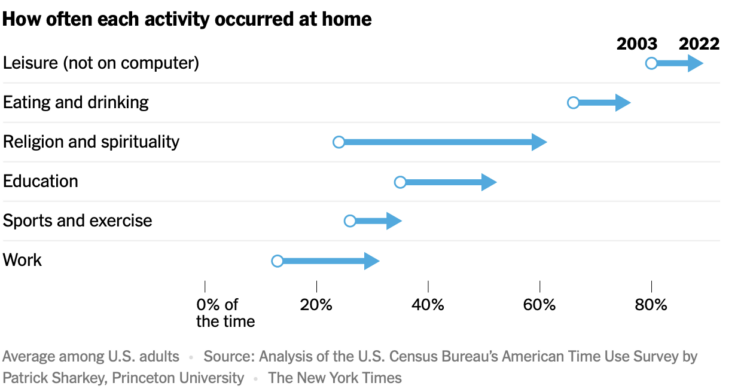
For NYT’s the Upshot, Ronda Kaysen and Alicia Parlapiano highlight analysis by Patrick Sharkey, which shows time spent at home relative to 2003. Based on data from the American Time Use Survey, the trend was increasing, but the pandemic helped push things along.
See also the change by activity group that I looked at a while back.
-
We mostly hear about a handful of swing states these days, as presidential campaigns focused more on optimizing resources. Research by Shaw et al. identifies the shifts and the state-by-state results. For the Washington Post, Hannah Dormido and Adrián Blanco show the changes as a set of maps over time.
In the 1950s, you see wide coverage between the Democratic and Republican parties. In the 2000s, the strategies grow more sparse. I suspect the internet and an increasing volume of data had something to do with that.
-
You’re probably going to see election forecasts more this month, and one candidate will have a higher chance of winning than the other. Even so, it won’t mean much, because the forecast is basically a coin flip. Nate Silver explains the chances in the context of gambling:
Gamblers understand this, perhaps like nobody else. Yes, if you think Harris is really a 55/45 favorite and prediction markets have it the other way, you have a profitable wager — but you’re still going to lose the bet almost half the time. (There have been much bigger discrepancies between models and prediction markets in the past.) In sports betting, the breakeven point on a point spread bet is generally 52.5 percent — that’s just enough to cover the vig — but most experienced bettors would avoid the 53/47 games1 to reduce variance and because there’s ultimately no way to know that your model is right. In poker, you can’t avoid making tough decisions — you always have to fold, raise/bet, or check/call — but many decisions in the game are so close that you’re literally supposed to randomize your play, employing a mixed strategy because being unpredictable outweighs any slight edge from one line being superior to another.
-
For The New Yorker, Jay Caspian Kang relates the election’s unwavering randomness to choices while gambling that probably don’t matter:
Forgive the jargon, but if you’re dealt an ace and a queen—a strong starting hand—in the big blind, and face a mid-position open, the best strategy, according to G.T.O. poker, is to three-bet x percentage of the time and just call the other times. What this means is that you can call or raise and both options are correct, as long as, over time, they’re in line with a rolling calculation of percentages. As a result, there’s a Zen to the modern poker strategy, which may be why I often watch these videos late at night when I can’t sleep. I especially appreciate the commentary of Phil Galfond, a personable former professional poker player, who now makes videos in which he says things like “In this spot, you can fold sometimes, call sometimes, and raise sometimes, and it’s probably fine.”
This is probably not the last gambling metaphor you’ll read this month.
-
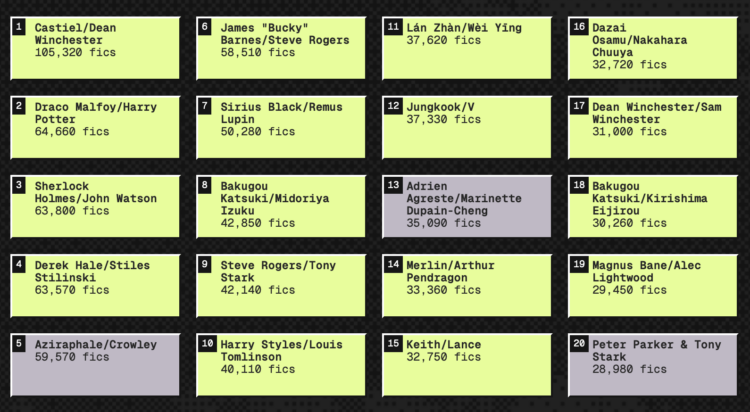
The Pudding examines who gets shipped, which means a pairing of characters in a relationship. Relationship types, demographics, and fandoms. Completely uninitiated to the world of fan fiction, I did not know many words going into this, but now I do.
-
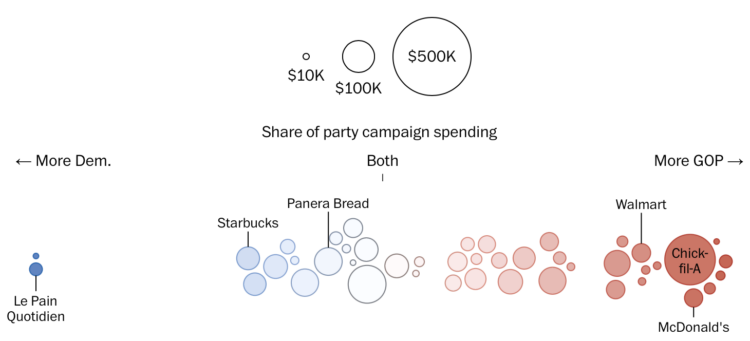
For WP’s Department of Data, Kati Perry and Adrián Blanco examine campaign spending through the lens of restaurant and cuisine preferences between political parties:
[W]e wanted to wrap our arms around a bigger question: where the campaigns spend the most money. We limited our analysis to places that racked up at least $5,000 in campaign spending, coming up with a list of roughly 500 popular restaurants and food purveyors, involving more than 21,000 receipts worth a collective $13 million.
See also the Department of Data’s previous party split analysis on names. They should do the thing where with each analysis, they go more and more ridiculous so that by election day they’re counting letter usage in rally speeches.




 Visualize This: The FlowingData Guide to Design, Visualization, and Statistics (2nd Edition)


