Speaking of grid maps and abortion access, Jan Diehm and Michelle Pera-McGhee, for The Pudding, estimated a complexity score (with variables from the Guttmacher Institute) for each state and made mazes to match the scores. Mazes are organized as a state grid map initially, but you can also sort by complexity, alphabetically, or by region.
Abortion mazes to represent the complexity of abortion access
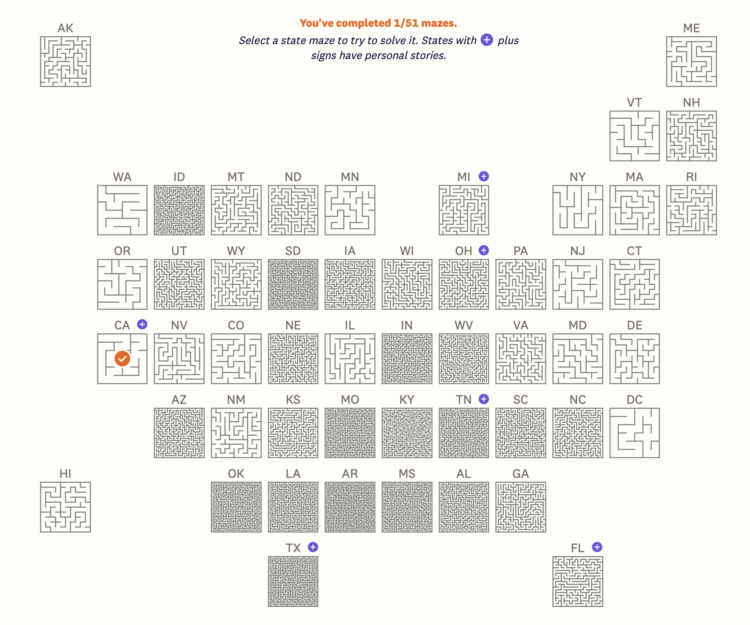
Chart Type Used

Second Edition
 Visualize This: The FlowingData Guide to Design, Visualization, and Statistics (2nd Edition)
 Visualize This: The FlowingData Guide to Design, Visualization, and Statistics (2nd Edition)
New tools, refined process.