On Multiple Views, the Interactions Lab talks about their experience as a design studio and how quickly implementations can change when you introduce real data into the system:
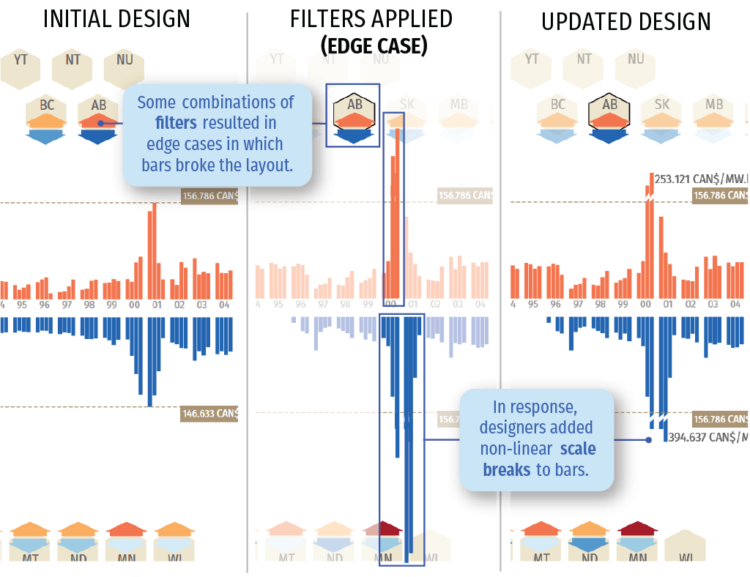
It’s easy to assume that the tools and approaches used for general software design apply equally to data visualization design. But data visualization design and interface design are often deeply and fundamentally distinct from one another. We learned this the hard way when we turned our research lab into a collaborative data visualization design studio for a few years. Data permeates visualization interfaces in ways that pose challenges at every stage of the design process. These challenges are even greater within large visualization teams. By reflecting on and articulating these challenges, we hope to inspire new, powerful data visualization design tools and communication processes.
Always start with real data. You’re wasting your time otherwise.
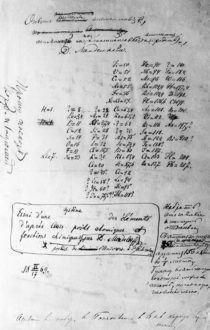 Visualization is a relatively new field. Sort of. The increased availability of data has pushed visualization forward in more recent years, but its roots go back centuries. Michael Friendly and Howard Wainer rewind back to the second half of the 1800s,
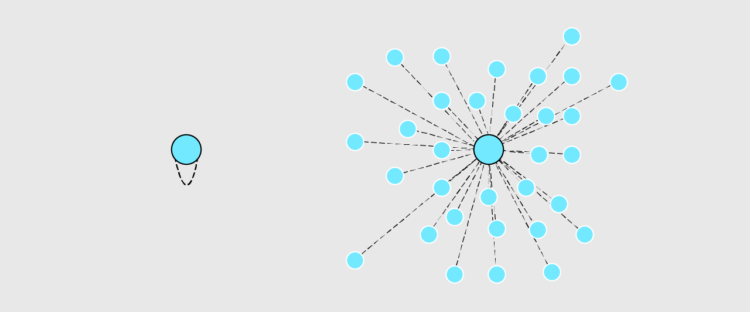
 Visualize This: The FlowingData Guide to Design, Visualization, and Statistics (2nd Edition)


