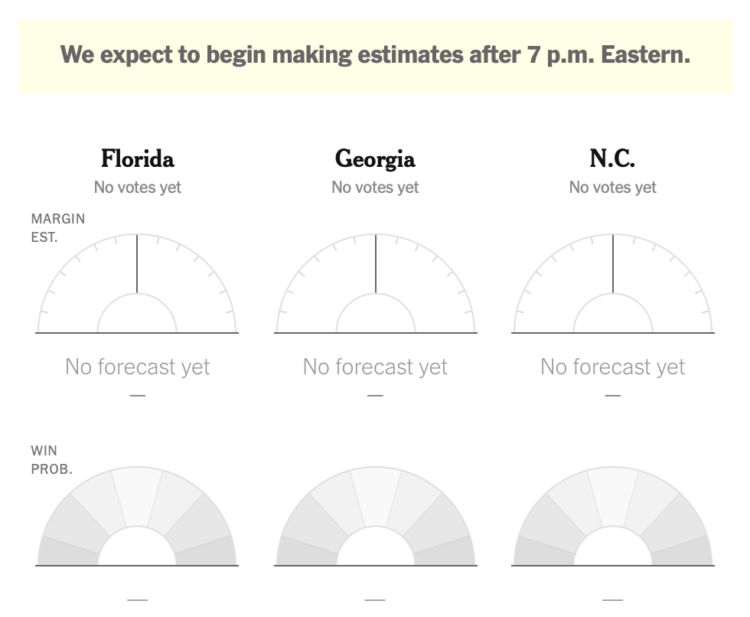
For The New York Times, Jonathan Corum illustrated the dozens of spacecraft orbiting planets and objects in the Solar System. The piece starts at the sun and then makes it way towards interstellar space. Showing active and inactive spacecraft, it’s part history lesson and part cute animation.
-
A $600 per week benefit expires for the unemployed at the end of July. Congress is still deciding what to do after. For The New York Times, Ella Koeze highlights the percentage of usual income the unemployed will receive as a function of annual earnings and weekly benefit amount if the benefit goes away.
Each dot represents a state. The percentage ranges in the background provide a point of reference for where each income group and state falls. The scrollytelling format starts with individual points and then tours through the shifts.
An aside: I might just be imagining things, but I feel like there’s been more scrollytelling lately. Is this a function of doomscrolling on our phones? Also, whenever a chart anchors in the background and a text frame scrolls over, I think of Snow Fall from 2012.
-
In search of songs that define music in the 1990s, Matt Daniels and Ilia Blinderman for The Pudding look for songs that that Gen Z still recognizes. Also, the songs that are mostly foreign to the younger generation:
In 1999, “Wild Wild West” was the song of the summer. Yet it is fading far faster than any other ’90s hit with comparable starting popularity. Twenty years ago, it was inescapable. Maybe Millennials are still too sick of it, even for nostalgia rotation. Perhaps it wasn’t even that great of a song to begin with, artificially inflated by Smith’s celebrity and cross-promotion with the film Wild Wild West.
Sorry, Will Smith.
The results are based on data gathered by The Pudding in an interactive survey.
-
Studies suggest that wide adoption of masks can reduce the spread of the coronavirus. A meta-analysis by Ali Mokdad and his research group at the Institute for Health Metrics and Evaluation estimates at least a 30% reduction and up to 50%, which can lead to a big difference, as illustrated by Connie Jin for NPR:
Wear the mask.
-
The numbers are high here in the United States, and at this point, they look bad on their own. But compare it to other countries that are currently hit hard, the U.S. looks even worse. For The New York Times, Lauren Leatherby makes the comparisons.
-
Pierre Ripoll provides several ways to visualize periodicity using animation. Moving dots, rotating spheres, concentric circles, oh my. He uses D3.js and it’s an Observable notebook, so you can see what’s going on under the hood.
-
Members Only
-
With lockdown orders arounds the world, places that we’re allowed to go sound different. The MIT Senseable City Lab looked at this shift in audio footprint through the lens of public parks:
Using machine learning techniques, we analyze the audio from walks taken in key parks around the world to recognize changes in sounds like human voices, emergency sirens, street music, sounds of nature (i.e., bird song, insects), dogs barking, and ambient city noise. We extracted audio files from YouTube videos of park walks from previous years, and compared them with walks recorded by volunteers along the same path during the COVID-19 pandemic. The analysis suggests an overall increase in birdsong and a decrease in city sounds, such as cars driving by, or construction work. The interactive visualization proposed in Sonic Cities allows users to explore and experience the changing soundscapes of urban parks.
The 3-D view shown above is visually interesting, but the top-down view is the easiest to read, looking like a stacked area chart over a map.
At distinct points on the mapped paths, a gradient line represents the distribution of quieter and louder sounds. Louder sounds appear to take up more space during the pandemic.
It’s hard to say how accurate the sound classification is through this view, but as I poked around, it seemed a bit rough. For example, the chart for Central Park in New York shows bird sounds making about 0% of the footprint, but you can hear birds pretty easily in the audio clips. I’d also be interested in how they normalized between YouTube clips and their own recorded audio to get a fair comparison.
Nevertheless, it’s an interesting experiment both statistically and visually. Worth a look.
-
Some industries are more compatible with remote work than others. Jonathan I. Dingel and Brent Neiman at the University of Chicago estimated the scale of the differences. For Reuters, Sarah Slobin reports using a variable width bar chart to show likelihood of close contact with others against likelihood of in person work:
Professional, management and technology jobs run the gamut from accountants and architects to lawyers, insurance underwriters and web developers. This group is much more likely to retain the privilege of collecting a paycheck while working remotely, and is based in major metropolitan areas, like New York and Los Angeles.
See additional breakdowns by geography and job loss.
-
For ProPublica, Caroline Chen, with graphics by Ash Ngu, provides a guide on how to understand Covid-19 statistics. The guide offers advice on interpreting daily changes, spotting patterns over longer time frames, and finding trusted sources.
Most importantly:
Even if the data is imperfect, when you zoom out enough, you can see the following trends pretty clearly. Since the middle of June, daily cases and hospitalizations have been rising in tandem. Since the beginning of July, daily deaths have also stopped falling (remember, they lag cases) and reversed course.
I fear that our eyes have glazed over with so many numbers being thrown around, that we’ve forgotten this: Every day, hundreds of Americans are dying from COVID-19. Some days, the number of recorded deaths has reached more than 1,000. Yes, the number recorded every day is not absolutely precise — that’s impossible — but the order of magnitude can’t be lost on us. It’s hundreds a day.
Cherrypicking statistics is at an all-time high. Don’t fall for it.
-
Unemployment has hit the United States hard over the past several months, for some harder than others. Lena Groeger reporting for ProPublica:
Part of the reason for this disparity is that many workers of color, especially Black workers, didn’t come into the crisis on equal footing. At the beginning of 2020, when the U.S. was at what most would have considered peak economic prosperity, the unemployment rate for Black workers was more than double that of their white counterparts. “The classic fact about Black unemployment,” said William Darity Jr., an economist at Duke University who studies racial inequality, “is that it’s been two times the white rate since we started measuring it.”
Each line represents a different subpopulation, so you can scroll over specific lines or select specific groups with the buttons. It’s similar to this New York Times interactive from 2009.
But this is 2020, so Groeger uses the overview as the initial view and then it shifts into scrollytelling. Groups highlight and the time frame expands as you read. This eventually takes you back to the initial view, where you’re invited to explore the data.
The overview first provides an opportunity for the reader to set a baseline as it relates to their own demographic. Then you see how specific groups are different or similar to that baseline. At the end, with a different baseline set, you can compare one more time.
-
Authors tend to focus on different body parts for men and women, and the descriptions used for each body part also vary. For The Pudding, Erin Davis parsed a couple thousand books to see the scale of the skews.
-
NYT’s The Upshot ran a survey through the data firm Dynata asking people how often they wear a mask in public. The Upshot then mapped the likelihood that a random group of five people are all wearing masks:
These variations reflect differences in disease risk and politics, but they also may reflect some local idiosyncrasies. Elizabeth Dorrance Hall, an assistant professor of communications at Michigan State University, said mask behavior can be subject to a kind of peer pressure: If most everyone is wearing one, reluctant people may go along. If few people are, that can influence behavior, too. Such dynamics can shape the behavior of friends, neighbors and communities.
As you might guess, it looks similar to the map of where people were staying at home.
-
Members Only
-
Twitter was hacked yesterday. Over a few hours, prominent accounts were tweeting that they were feeling generous during these times, and that if you sent them Bitcoin, they would send double the amount back. For The New York Times, Matthew Conlen and Lazaro Gamio show the Bitcoin scammed as more tweets flowed in.
-
A million dollars. A billion dollars. The latter is 1,000 times more than the former. Just add a few zeros, right? Tom Scott used a road trip to visualize the actual difference in scale.
[arve url=”https://www.youtube.com/watch?v=8YUWDrLazCg” loop=”no” muted=”no” /]
Scott starts by setting the baseline of a million dollars with a short, one-minute walk. Stack one million dollar bills after the other and it’s about the length of a football field. Stack one billion, and he has to drive for an hour.
Oh scale, you are a tricky thing.
It reminds me of the scaled solar system a few years ago. Earth was sized as a marble, and distance and the size of everything else was scaled accordingly.
-
If you’re interested in a specific chart type, you can now browse FlowingData by all of the major ones. Find tutorials, guides, and examples for plenty of inspiration for the data you’re trying to visualize.
A few years ago, I added a new meta field to posts that indicated what kind of chart was used. I originally intended it as a way to make tutorials on FD easier to find and to categorize projects in some way. Then I started marking posts that served as a good examples of any given chart type.
I’ve been doing this off and on and adding new types as they come in. But I never made it obvious, and I don’t think many people noticed the extra field for some of the posts.
So it’s more obvious now. Browse all of the chart types so far.
-
Working from home was an ideal that many strived for. For many, it still is, but for those with kids who have to learn from home, the schedule change is less than ideal.
-
One way to estimate the impact of the coronavirus is to compare it against expected mortality. People are still dying of other causes. The virus has increased the total counts around the world. The New York Times compared these increases against other deadly events:
Only the worst disasters completely upend normal patterns of death, overshadowing, if only briefly, everyday causes like cancer, heart disease and car accidents. Here’s how the devastation brought by the pandemic in 25 cities and regions compares with historical events.
The result is a vertical scroll that starts at a normal mortality rate and takes you through increasingly deadlier events like the HIV/AIDS crisis, Hurricane Katrina, and eventually up to the Spanish Flu outbreak. You see how the coronavirus increased deaths in major cities along the way.
When you couple these events with memories of how we reacted, the current state of affairs is tough to comprehend.