For Our World in Data, Max Roser discusses the risk and possible destruction…
Statistical Visualization
Finding patterns, distributions, and anomalies.
-
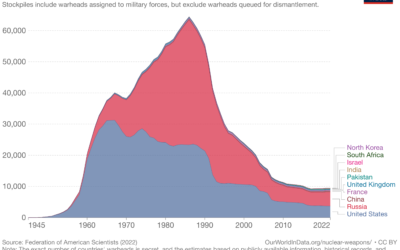
Reducing the risk of nuclear war
-
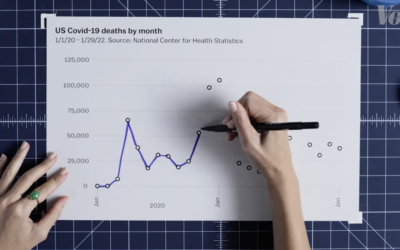
Stat-driven view on how American conservatives shifted against vaccine
As we know by now, conservatives in the U.S. are more commonly against…
-
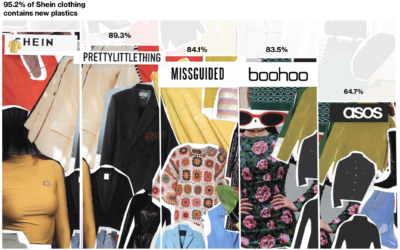
Fashion industry’s environmental impact
For Bloomberg, Rachael Dottle and Jackie Gu look at the current state of…
-
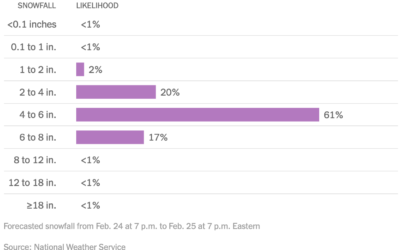
Distribution of snowfall estimates to show uncertainty
For NYT’s The Upshot, Aatish Bhatia, Josh Katz and Margot Sanger-Katz show the…
-
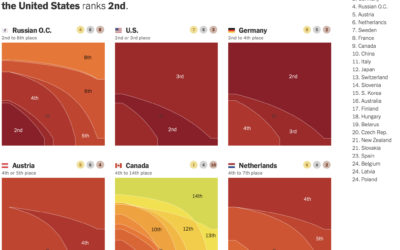
Weighted Olympic medal counts
To decide who’s doing best at the Olympics you have to define what…
-
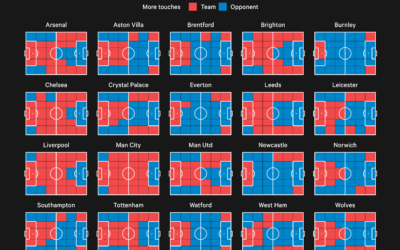
Premier League territory control
The Athletic charted territories on the field to show whether the team of…
-
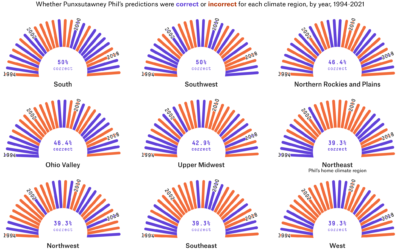
Accuracy of groundhog weather prediction
For FiveThirtyEight, Simran Parwani and Kaleigh Rogers compared Groundhog Day predictions against actual…
-
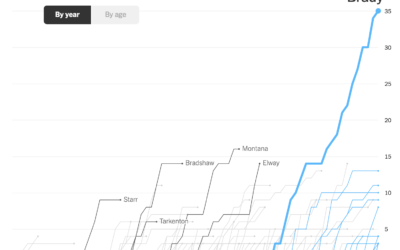
Charts showing Tom Brady’s standout career
Tom Brady announced his retirement from the National Football League, which ends a…
-
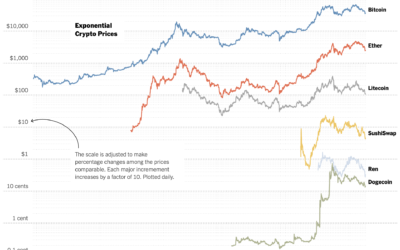
Crypto volatility charts
One of the attractions of crypto is that values can swing into the…
-
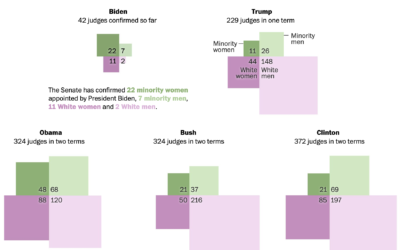
Diversity of federal judge picks, compared by president
Adrian Blanco for The Washington Post used squares connected at the corners to…
-
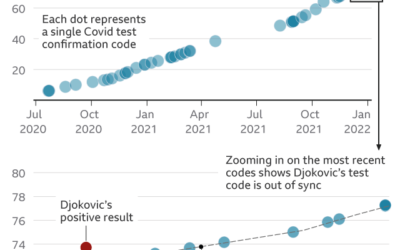
Questioning Novak Djokovic’s Covid tests, based on data
Tennis player Novak Djokovic is not vaccinated against the coronavirus, and as a…
-
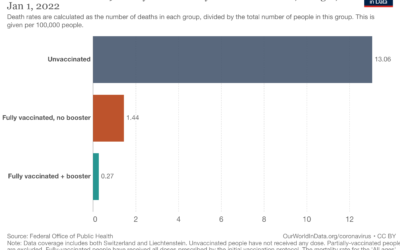
Death rates by vaccination booster status
Our World in Data continues their important work on providing and showing up-to-date…
-
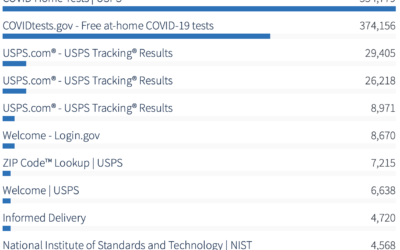
Analytics for U.S. government websites
With the announcement of free Covid-19 tests through the United States Postal Service,…
-
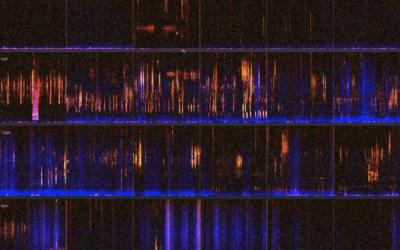
A visual and audio tour of sound at Nap Nap Swamp
When I think swamp noise, I imagine a blob of sound that’s some…
-
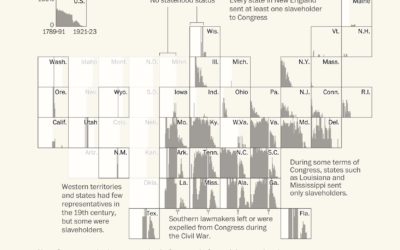
Congressmen who enslaved people
Using old Census records and documents, Julie Zauzmer Weil, Adrian Blanco and Leo…
-
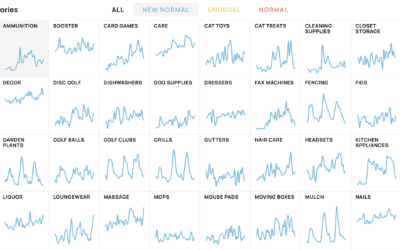
New shopping search patterns from the pandemic
Schema Design, Google Trends, and Axios collaborated on The New Normal, looking at…
-
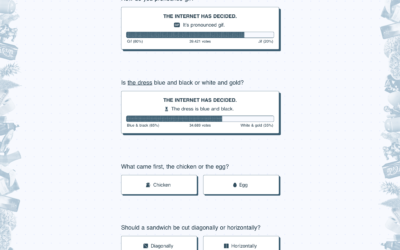
Settling all the internet debates in one go with a bunch of polling
The internet was once this fun place where people had goofy debates about…
-
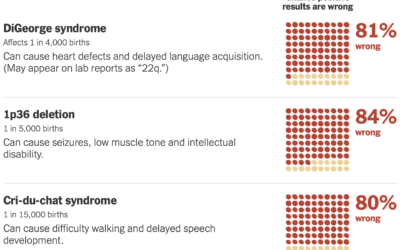
False positives with prenatal tests for rare conditions
Sarah Kliff and Aatish Bhatia for NYT’s The Upshot look at the uncertainty…
Recently for Members
Second Edition
 Visualize This: The FlowingData Guide to Design, Visualization, and Statistics (2nd Edition)
 Visualize This: The FlowingData Guide to Design, Visualization, and Statistics (2nd Edition)
New tools, refined process.
Browse by Chart Type See All →


