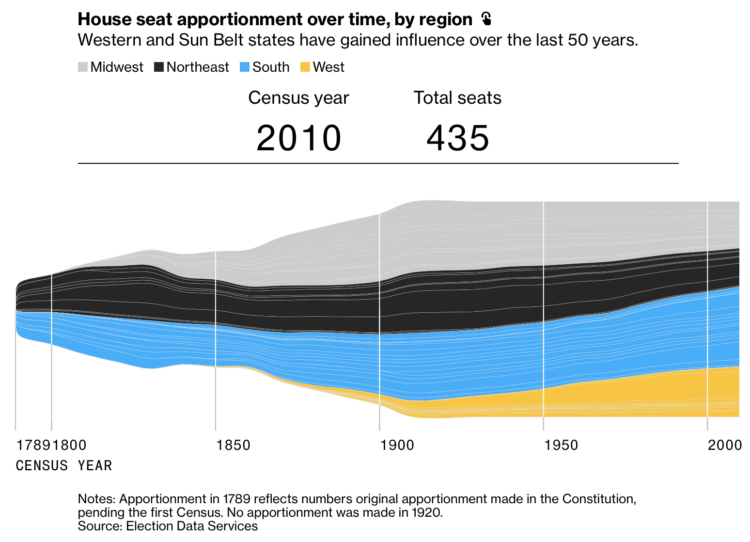
The 2020 Census count at the state level is set for release this afternoon, April 26 at 12pm PST. While we wait, Gregory Korte and Allison McCartney, reporting for Bloomberg, show which states are expected to lose and gain representation.
I appreciate the streamgraph that shows how the distribution of seats changed over the decades, along with the bar chart mouseover so you can see the shift for each state individually.

 Visualize This: The FlowingData Guide to Design, Visualization, and Statistics (2nd Edition)