Visualization
Showing the stories in data through statistics, design, aesthetics, and code.
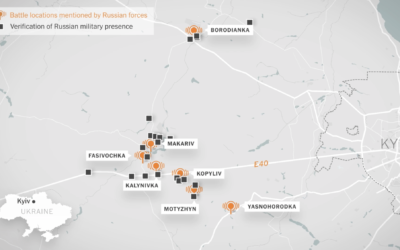
Intercepted Russian radio communications
The New York Times analyzed Russian radio communications near Kyiv. The unencrypted transmissions,…
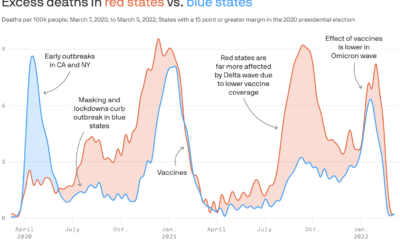
Partisan excess deaths
Excess deaths is the difference between expected deaths based on historical data and…

Pollution by the rich versus poor
Based on estimates from the World Inequality Lab, Bloomberg shows how wealthier individuals’…
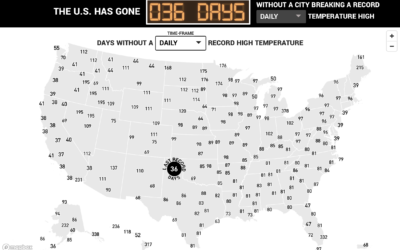
Days since record-high temperatures
Here’s a fun/alarming weather map from The Pudding. Using data from the Applied…
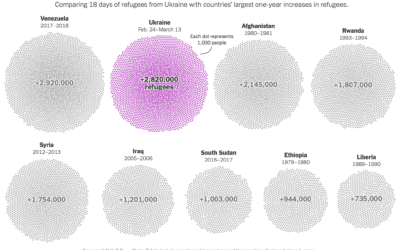
Total refugees from Ukraine, compared to other countries
Millions of Ukrainians (over three million as of this writing) have left their…
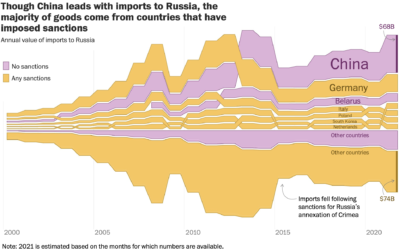
Imports to Russia from countries that imposed sanctions and not
For The Washington Post, Andrew Van Dam, Youjin Shin and Alyssa Fowers plotted…

US spending on Ukraine
For NYT’s The Upshot, Bianca Pallaro and Alicia Parlapiano break down the United…
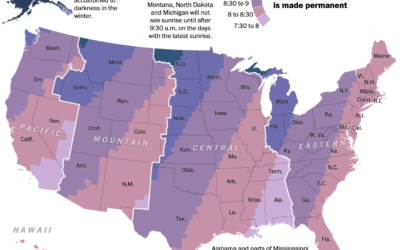
Sunrise times with permanent Day Light Saving
Changing the clocks twice a year can be a hassle, so some people…

Abortion restrictions in the U.S. mapped
For FiveThirtyEight, Anna Wiederkehr and Amelia Thomson-DeVeaux, with illustrations by Nicole Rifkin, delve…

Your place in the world population
Population.io by World Data Lab asks your birthday, country of residence, and gender.…
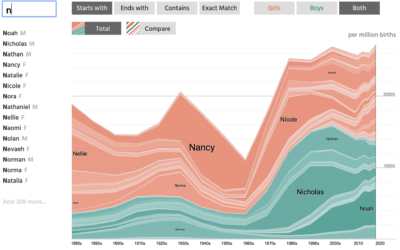
NameGrapher to explore past baby name trends
NameGrapher is an interactive chart that lets you explore historical trends for baby…

Percentage breakdowns of pandemic life
To broadly show how people have lived in the U.S. during these past…
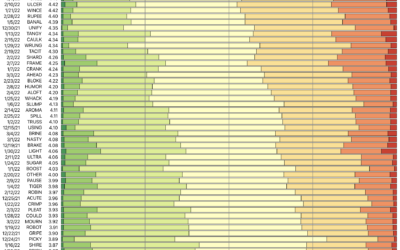
Wordle analysis through the lens of 15m tweets
I don’t know if you’ve heard of it, but there’s this game called…
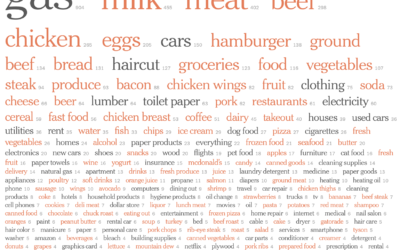
Price increases people have noticed
Inflation is high. For NYT’s The Upshot, Emily Badger, Aatish Bhatia and Quoctrung…
Reducing the risk of nuclear war
For Our World in Data, Max Roser discusses the risk and possible destruction…
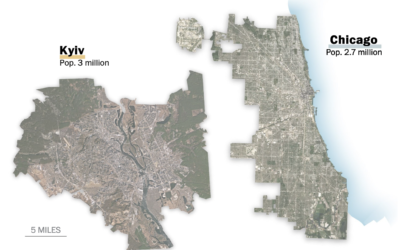
Empty Ukrainian airspace
As you would imagine, Ukrainian airspace looks empty right now. Reuters mapped flights…
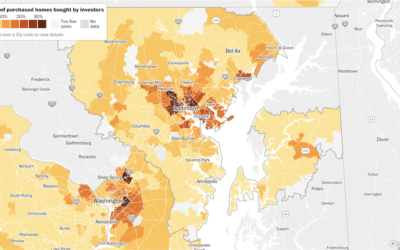
Investors bought up a lot of houses in 2021
Home prices in the U.S. increased dramatically over the past couple of years.…