Visualization
Showing the stories in data through statistics, design, aesthetics, and code.
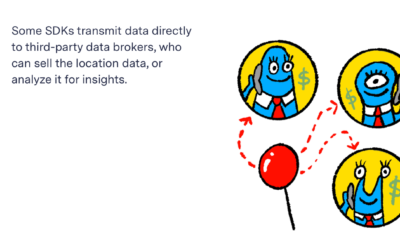
Unregulated location data industry
For The Markup, continuing their reports on data privacy, Alfred Ng and Jon…
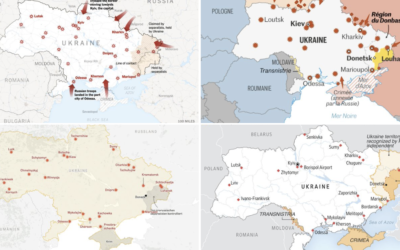
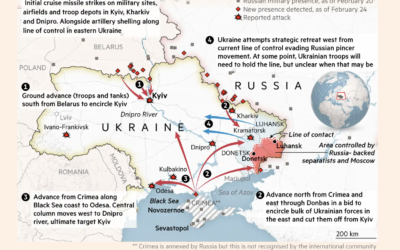
Why Russia is invading Ukraine, a visual guide
[arve url=”https://www.youtube.com/watch?v=If61baWF4GE” /]
RealLifeLore explains the history between the two countries and the…
Tracking the sanctions against Russia
Correctiv is tracking sanctions against Russian individuals and companies, based on data from…
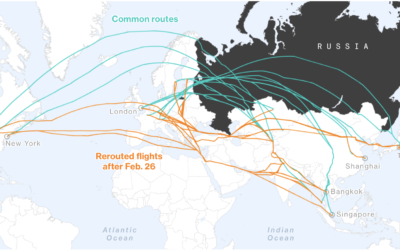
Rerouted flights to avoid Russian airspace
Many countries have banned Russian aircraft from entering their airspace. Russian in turn…

Stat-driven view on how American conservatives shifted against vaccine
As we know by now, conservatives in the U.S. are more commonly against…
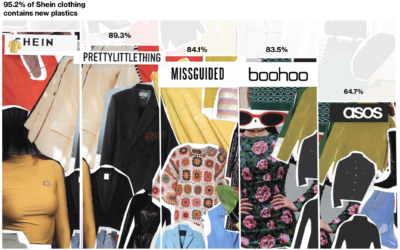
Fashion industry’s environmental impact
For Bloomberg, Rachael Dottle and Jackie Gu look at the current state of…
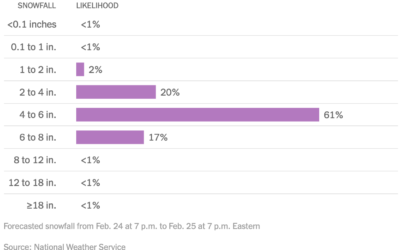
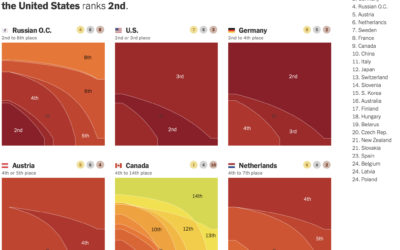
Distribution of snowfall estimates to show uncertainty
For NYT’s The Upshot, Aatish Bhatia, Josh Katz and Margot Sanger-Katz show the…

More readable writing illustrated with more readable writing
For The Pudding, Rebecca Monteleone and Jamie Brew (with design and code by…
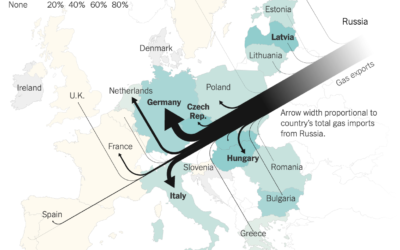
Map of Russian gas exports
Speaking of Russian gas, Josh Holder, Karl Russell and Stanley Reed for The…
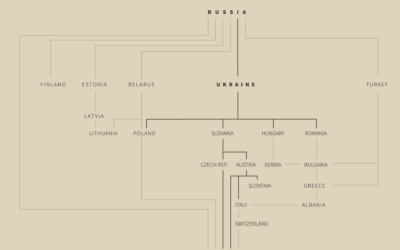
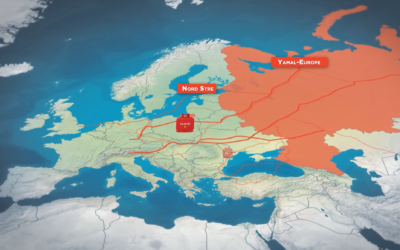
Russian gas supplies in Europe
For Reuters, Prasanta Kumar Dutta, Samuel Granados and Michael Ovaska detail Europe’s dependence…
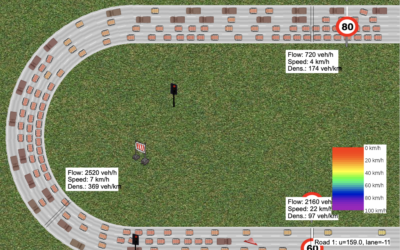
Interactive traffic simulator
Traffic always seems so sensitive to the smallest disruptions. Someone pulls over to…
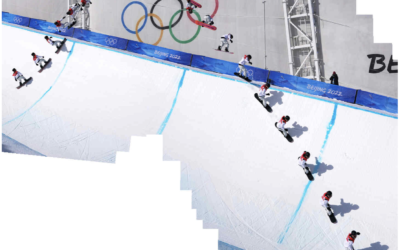
Snowboarding composite photos
If you watched the men’s halfpipe in the Olympics, you were probably impressed…
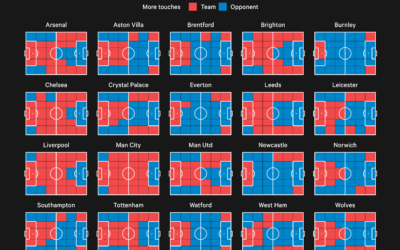
Premier League territory control
The Athletic charted territories on the field to show whether the team of…

Modernized version of a mid-19th century encylopedia
Between 1849 and 1851, J.G. Heck published a 10-part encyclopedia called Iconographic Encyclopædia…
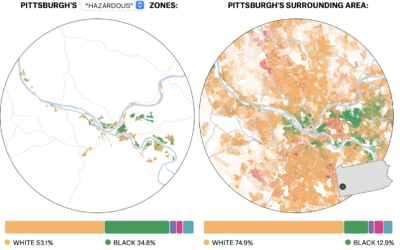
Past redlining still seen in the present
In the 1930s, a group called the Home Owners’ Loan Corporation went to…