In celebration of the lunar new year, many people release a lantern into…
Nathan Yau
-

Release your lantern
-
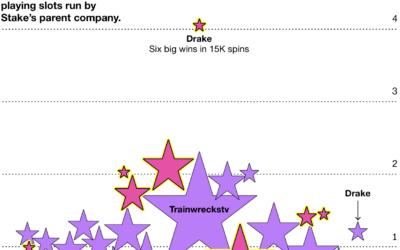
Unusual luck for streamers in the crypto casino Stake
For Businessweek, Cecilia D’Anastasio, Olivia Solon, and Leon Yin analyzed the unusual luck…
-

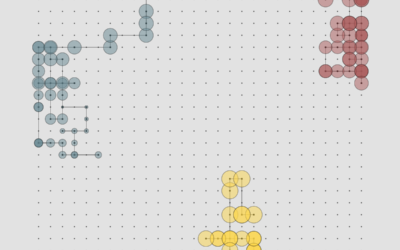
Famous chess matches visualized as 3-D wireframes
Imagine points for each piece on a chessboard. They move to x-y positions…
-
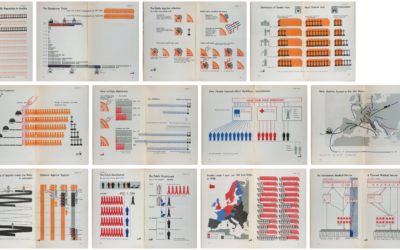
Visual catalog of Isotype examples
Isotype, or International System of Typographic Picture Education, is a picture language used…
-
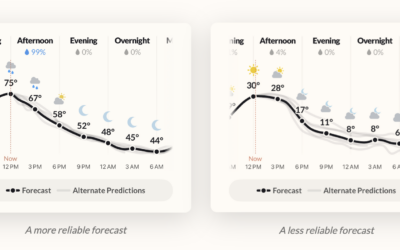
Weather forecast app, with uncertainty as a core feature
The folks who made Dark Sky, my once go-to weather app that was…
-
Members Only
Visualization tools and resources, February 2026 roundup
Here is what happened in February.
-

Illustrated engineering in everyday objects
Mechanical Pencil is a project by Bryan Macomber that illustrates the mechanical bits…
-
Mysteries of women’s clothing sizes
The challenges continue for women who want clothes that fit properly. For the…
-
Regional biases and stereotypes in ChatGPT models
LLMs are based on data and text collected from the internets, so as…
-

Dialed, a color memory game
People are usually not great at remembering exact colors. Dialed is a fun…
-
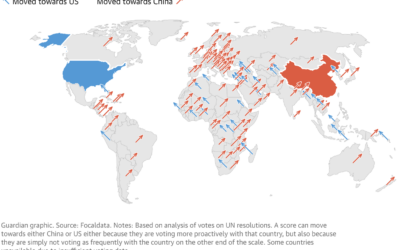
Map of countries aligning with China
Using an analysis from Focaldata, the Guardian used the angled arrow approach to…
-
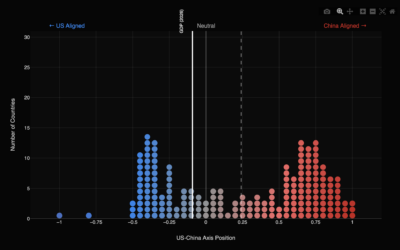
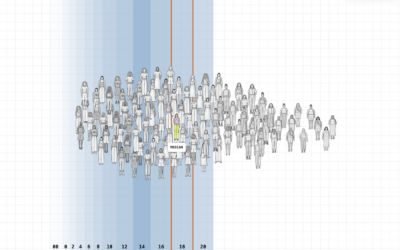
Geopolitical axis between the United States and China
Focaldata calculated United Nations voting patterns by country, relative to the United States…
-
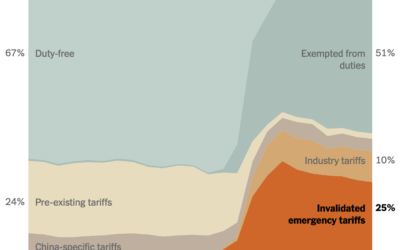
Invalidated tariffs
The U.S. Supreme Court ruled the administration’s “emergency” tariffs to be illegal. This…
-
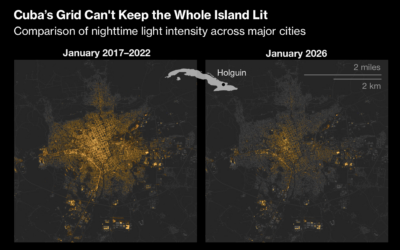
Maps show not enough electricity in Cuba
For Bloomberg, Krishna Karra and Stephen Wicary map blackouts in Cuba due to…
-
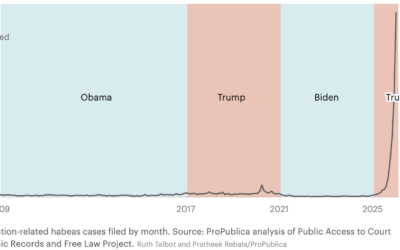
Immigrants challenging their detention in historic number of cases
ProPublica and the Texas Tribune report on the spike of claims over the…
-
Coding on the train
Paul Ford, for NYT Opinion, on his outlook for making software by vibe…
-

Most common fields of study, from 1970 to now
Over the decades, we can see the shifts (and non-shifts) in professional priorities and interests by looking at what college students are studying.
-
Members Only

Rank and order
This week is about how we rank from best to worst and use visualization to highlight order.
-
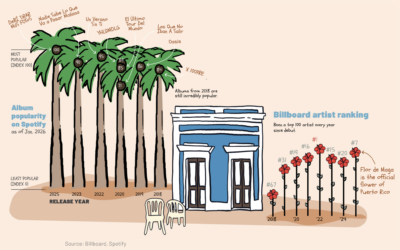
Rise of Bad Bunny
For Reuters, Ally J. Levine and Tiana McGee illustrate and chart the rise:…
-
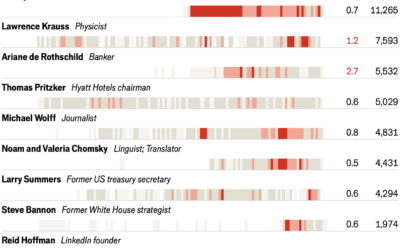
Jeffrey Epstein’s network via 1.4m emails
With the most recent Epstein release, the Economist collaborated with the folks who…
Recently for Members
Second Edition
 Visualize This: The FlowingData Guide to Design, Visualization, and Statistics (2nd Edition)
 Visualize This: The FlowingData Guide to Design, Visualization, and Statistics (2nd Edition)
New tools, refined process.
Browse by Chart Type See All →


