In Major League Baseball, a player hits a home run when the ball…
Nathan Yau
-
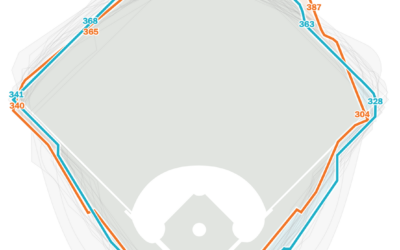
Comparing home run in distance different stadiums
-
Barbie and Oppenheimer themes for charts in R
Matthew Jané made a small R package called Theme Park, which is meant…
-
Members Only

Visualization Tools and Learning Resources, July 2023 Roundup
This is the good stuff for July.
-

Racing amateurs against Tour de France cyclists
It takes strength and dedication to race in the Tour de France. It’s…
-
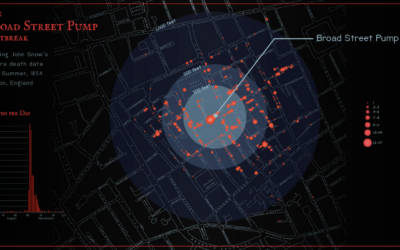
John Snow’s cholera map, an animated version
Sarah Bell made an animated version of John Snow’s classic map from 1854.…
-
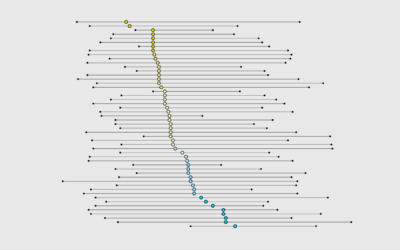
When is Dinner, by State
These are the states that eat dinner the earliest and latest, along with everyone else in between.
-
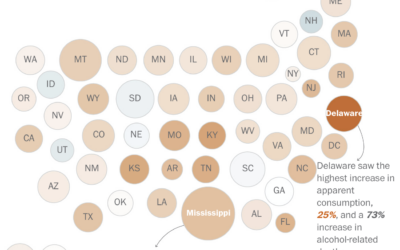
Increasing alcohol-related deaths
Alcohol consumption, based on ethanol volume estimates, has been rising over the past…
-
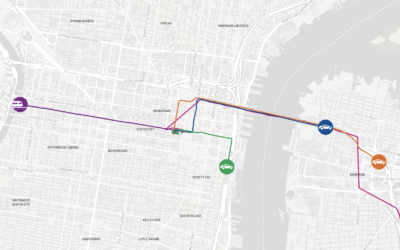
A race to find the best route to the Jersey Shore
To find the fastest route from Philadelphia to the Jersey Shore, The Philadelphia…
-
Members Only
Mundane Data Stories
A bunch of boring data points makes a pattern.
-

Understanding the SVG path element, a visual guide
The SVG path element can be useful for drawing regular and irregular shapes.…
-
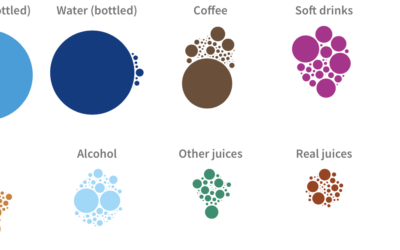
What Americans drink and their changing habits
When I was a kid, I drank a lot of milk, and bottled…
-
Manual data labeling behind the AI
One of the things that makes AI seem neat is that it sometimes…
-
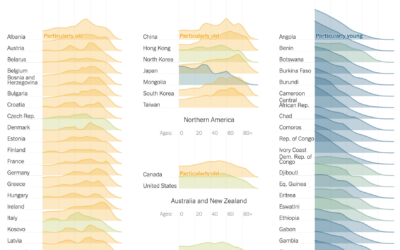
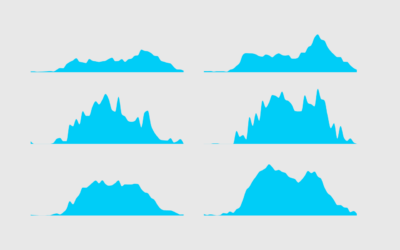
Age shifts around the world
The world is getting older overall. For The New York Times, Lauren Leatherby…
-
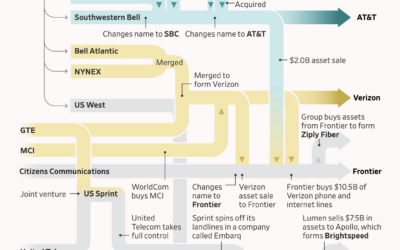
Flowchart showing the splits, mergers, and acquisitions of the former Bell Telephone Company
Bell System’s monopoly broke up in 1984 leading to independent phone companies, which…
-
Members Only
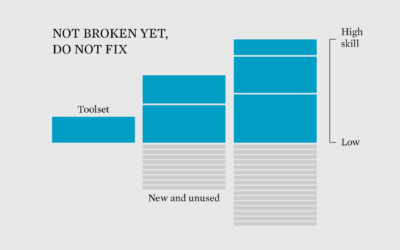
When I Switched Visualization Tools
With all the new tools available, maybe it’s time to add to the existing toolset.
-

Outsourced work and generative AI
For Rest of World, Andrew Deck turned the AI focus on outsourced workers,…
-

A rubber stamp for graph axes
For graphing on the go, Present & Correct offers a rubber stamp with…
-
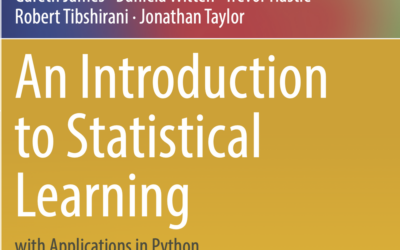
Introduction to statistical learning, with Python examples
An Introduction to Statistical Learning, with Applications in R by Gareth James, Daniela…
-
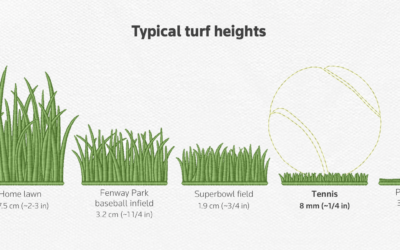
Wimbledon grass patterns
This might surprise you, but the grass at the Wimbledon tennis tournament is…
-
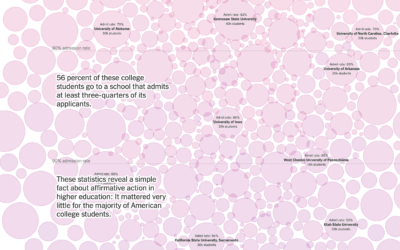
Focusing on the majority of students not affected by affirmative action
For NYT Opinion, Richard Arum and Mitchell L. Stevens, with graphics by Quoctrung…
Recently for Members
Second Edition
 Visualize This: The FlowingData Guide to Design, Visualization, and Statistics (2nd Edition)
 Visualize This: The FlowingData Guide to Design, Visualization, and Statistics (2nd Edition)
New tools, refined process.
Browse by Chart Type See All →


