For all the maps by Eric Fischer I’ve posted, it’s amazing how little…
Nathan Yau
-
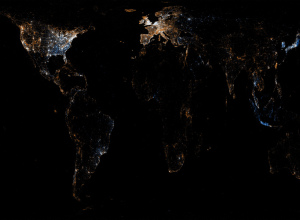
Flickr and Twitter mapped together – See Something or Say Something?
-
Why learning code for data is worthwhile
There are lots of tools that have come out in the past couple…
-
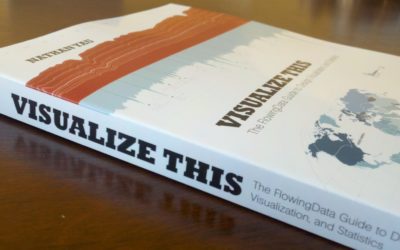
Visualize This: Published
Right now, at this very moment, I have an actual physical book on…
-
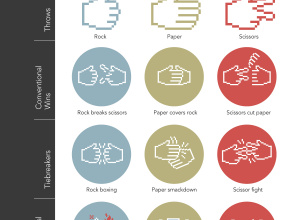
Expanded rules for Rock-paper-scissors
We already learned how to win Roshambo every time, but there’s actually more…
-
Wow vs. Ah-ha for data graphics
After attending the Eyeo Festival, Zach Gemignani of Juice Analytics noticed a difference…
-
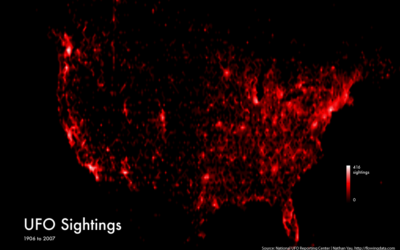
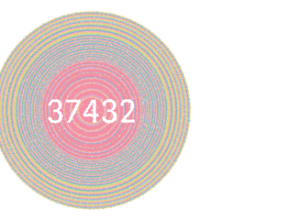
Where the aliens are flying their UFOs
I came across some UFO sightings data on Infochimps, from the National UFO…
-
Best of FlowingData – June 2011
We’re already more than halfway through the year. Time…moving…too…fast. Is there a pause…
-
Link
Avoiding Loops in R →
Slow loops? Maybe these alternative will help
-
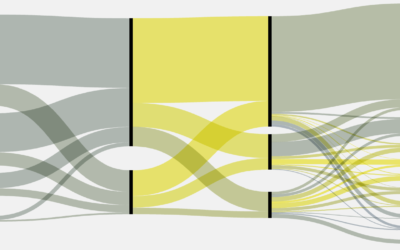
Make Sankey flow diagrams with Fineo, sort of
Whenever I post a Sankey diagram (for example, here, here, and here), someone…
-
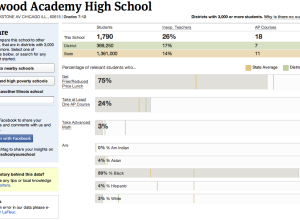
Access to education where you live
If you’re a parent, most likely you want your children to go to…
-
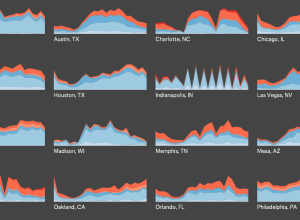
When crime happens in major cities
Does more crime happen during the late hours of the night or in…
-
FlowingData is brought to you by…
A big thank you to the FlowingData sponsors. This little blog wouldn’t be…
-
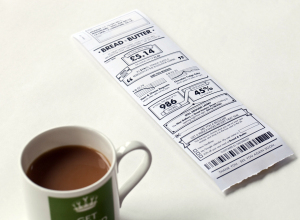
Sales receipt redesign
Design firm Berg rethinks the everyday sales receipt under the premise that registers…
-
Link
The History of Cartography →
Complete Volume 1 from 1987, available for free
-
Hitler learns topology
In another reword of the pivotal scene in Der Untergang, Adolf Hitler learns…
-
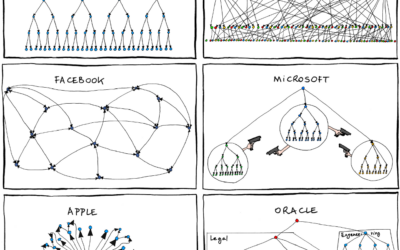
Organizational charts in major tech
Manu Cornet caricaturizes org charts of major tech companies, such as Amazon with…
-
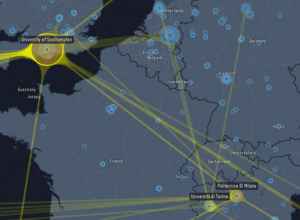
Custom maps in Processing
Till Nagel teaches you how to design custom maps in Processing with TileMill.…
-

Takin’ data to the streets. Word.
Whenever I’m out late at night with my bottle of black spray paint…
-
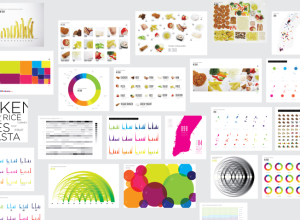
A year of food consumption visualized
My pending thesis is on personal data collection (i.e. quantified self, personal informatics,…
-

DataBot mouse makes larger files physically harder to move
Files and folders on your computer look and feel the same regardless of…
Recently for Members
Second Edition
 Visualize This: The FlowingData Guide to Design, Visualization, and Statistics (2nd Edition)
 Visualize This: The FlowingData Guide to Design, Visualization, and Statistics (2nd Edition)
New tools, refined process.
Browse by Chart Type See All →


