Lisa Strausfeld, in collaboration with GE, compares perceived country rankings and actual ones.
Innovation is the key driver of business and economic success. In January 2011, GE developed an Innovation Barometer based on a survey of 1000 senior business executives in 12 countries. We asked about both the drivers and impact of innovation. In this visualization, we’re taking a deeper look, enabling comparisons between what execs believe drive innovation and what’s actually happening in market.
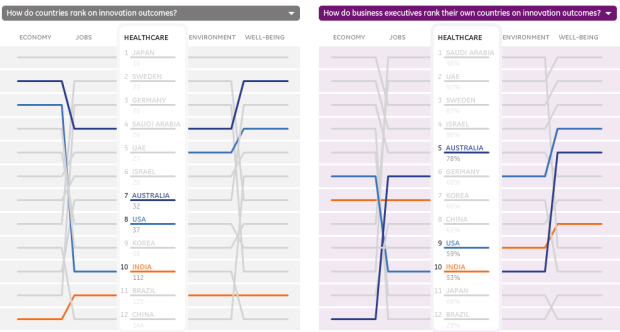
As seen in the image above, rankings are displayed via parallel coordinates, with actual country rankings on the left and perception on the right. The business execs were asked if they thought their country was “successful” in the categories, and the perceived rankings are based on the percentage who said yes. Each line represents a country. Roll over a country on either side to compare the patterns.
Looking at perceived vs. actual for the United States, for example, the up and down looks roughly the same.

On the other hand, business executives in Japan appear to be more modest. Or maybe more demanding. Or honest. In all but the well-being category, Japan ranks in the top half of the 12 selected countries, but in the perceived side, Japan is at or near the bottom except in economy.

It should be noted, however, that the healthcare rankings come from a 2000 study by the World Health Organization, whereas the survey was taken in 2011, so that might account for some discrepancies.
At first I thought it would be better to have each category side-by-side, so that you could compare rankings directly (e.g. column for actual and perceived economy would be next to each other), but I started liking the current approach after playing for bit.
[GE Data Visualization | Thanks, Peter]
 Visualize This: The FlowingData Guide to Design, Visualization, and Statistics (2nd Edition)
While I like the visualization, there are some major problems with the data, and their comparability. Perceived education is percentage of leaders who think that schools and universities provide a strong model for today’s innovative leaders, and actual education is…. percentage of degrees in math, science, and engineering? I don’t see the two as comparable.
Also, it is important to note how flawed, like many of the “studies”, the WHO rankings are/were. http://www.commentarymagazine.com/article/the-worst-study-ever/
hahahaha … an 11 year discrepancy in statistic gathering date and all you can say is that it “might” account for the discrepancies. Funny guy!
You never know until you actually look at the data.