You know those graphics that use icons of people to represent units or…
Nathan Yau
-
People font
-
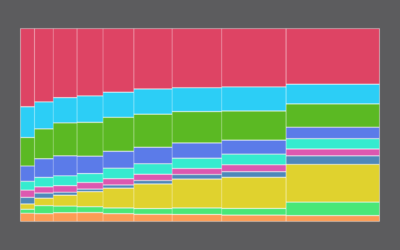
How Different Income Groups Spend Money
After living expenses, where does the money go, and how does it change when you have more cash available?
-
Olympians in your living room through augmented reality
Well this is awesome. The Winter Olympics start this Friday, and The New…
-
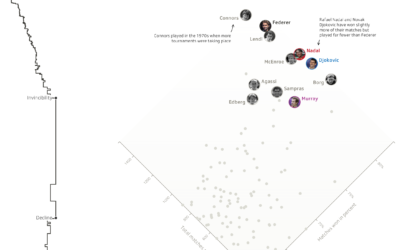
Roger Federer career in rankings and wins
Professional tennis player Roger Federer won his 20th Grand Slam title recently. He’s…
-
Scissors congruence
The Wallace–Bolyai–Gerwien theorem says that if you have two polygons of equal area,…
-
Statistics crash course
Odds are if you’re reading this, you know what statistics is already, but…
-
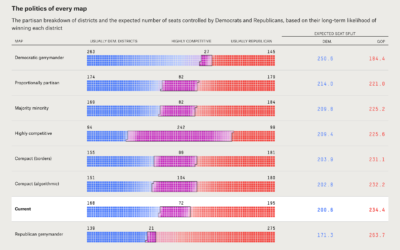
Redistricting the congressional map with different goals
FiveThirtyEight asks, “There’s a lot of complaining about gerrymandering, but what should districts…
-
Bruises
Musician Kaki King’s daughter suffers from a condition (Idiopathic Thrombocytopenic Purpura) where her…
-
Members Only
How I Made That: Animated Square Pie Chart
Also known as waffle charts. Using animated transitions between values, you can allow for comparisons between categories.
-
Link
Over Heard: A design exploration of the On Being archive →
The process of building a client project with varied expectations along the way.
-
Secret army bases seen in public fitness tracking map
Last year, fitness tracking app Strava released a high detail map of public…
-
Visualizing Incomplete and Missing Data
We love complete and nicely formatted data. That’s not what we get a lot of the time.
-
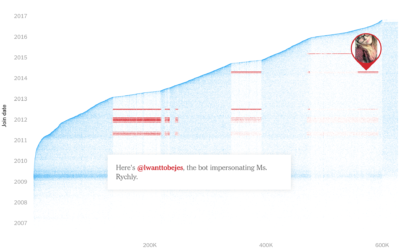
Finding fake followers
This fake follower piece by Nicholas Confessore, Gabriel J.X. Dance, Richard Harris, and…
-
Hand-drawn how-to instructions using zero words
Inspired by Dear Data, the data drawing pen pal project, designers Josefina Bravo,…
-
Release strategies for Oscar-nominated films
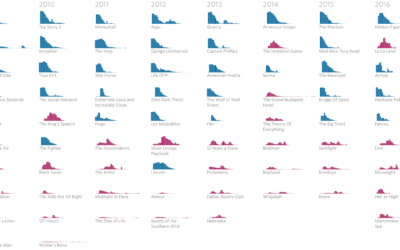
Evie Liu and William Davis, reporting MarketWatch, looked at release strategies of Oscar…
-
Is there something wrong with democracy?
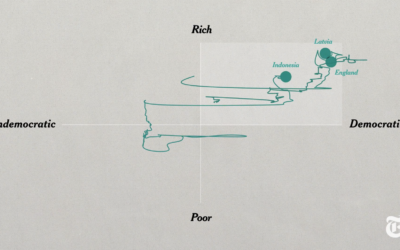
Max Fisher and Amanda Taub, for The New York Times, answer the question…
-
World population estimator and gridded data from NASA
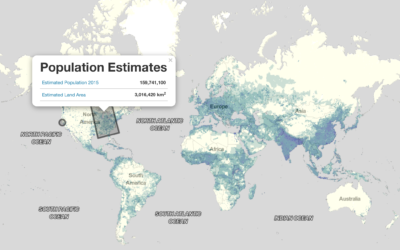
Population data typically comes in the context of boundaries. City data. County data.…
-
The Demographics of Others
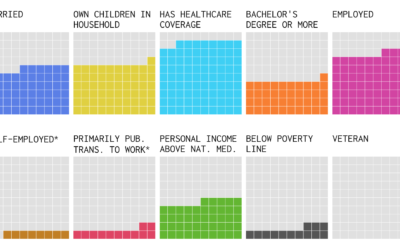
I think we can all benefit from knowing a little more about others these days. This is a glimpse of how different groups live.
-
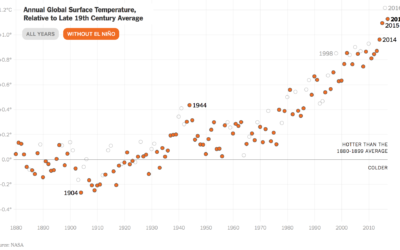
Surprise, the world was warmer again in 2017
According to NASA estimates, 2017 was the second warmest year on record since…
-
Data to identify Wikipedia rabbit holes
New data dump from the Wikimedia Foundation:
The Wikimedia Foundation’s Analytics team is…










 Visualize This: The FlowingData Guide to Design, Visualization, and Statistics (2nd Edition)


