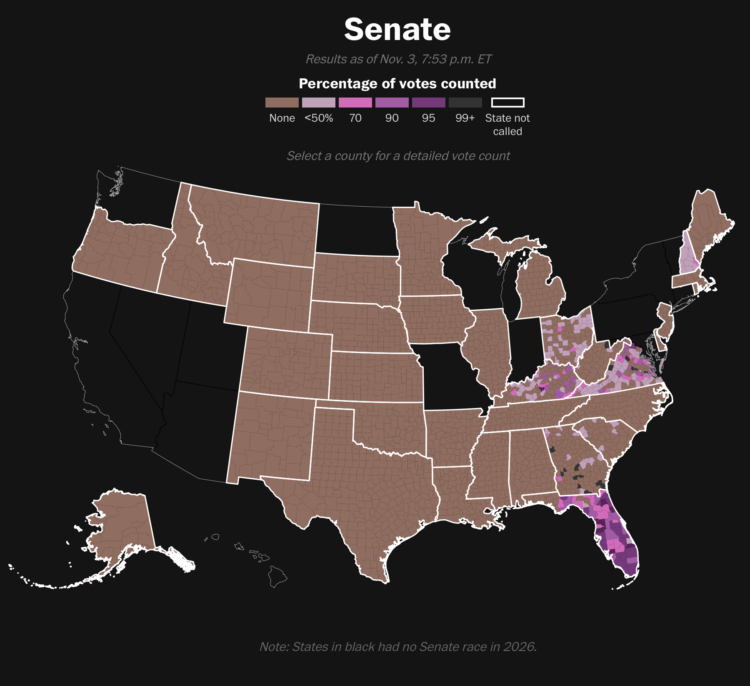
For the Washington Post, Dylan Moriarty has a live tracker for the percentage of votes counted. There is still a ways to go.
For the Washington Post, Dylan Moriarty has a live tracker for the percentage of votes counted. There is still a ways to go.
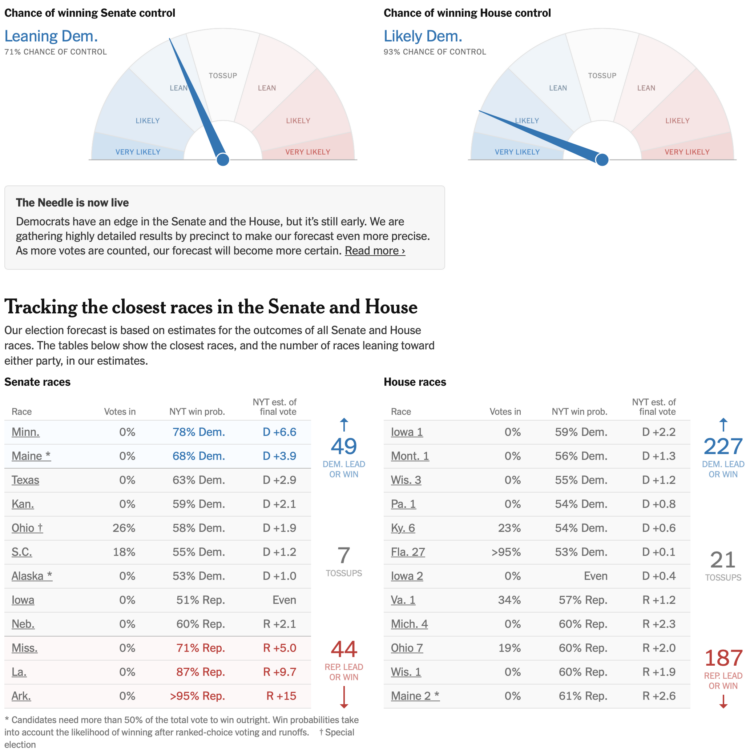
If feeling uncertain is your thing, the Needle from the New York Times is live to show the chances of each party winning Senate and House control. Views for individual races are also available.
I suggest waiting until later in the evening before you watch the swings. Do it for your heart.
As midterm election results come in tonight, percentages can flip in favor of a candidate in a way that seems artificial if you don’t know what you’re watching. For the New York Times, Christine Zhang describes election night “mirages” that explain the sudden changes.
This is especially important tonight while watching the needle of uncertainty. It’s coming back tonight.
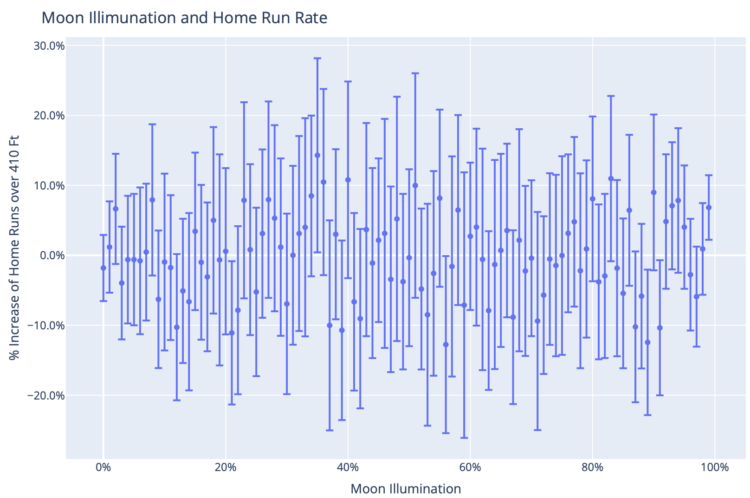
During the World Series, Google ran an ad for Gemini that noted several correlations between home runs and full moons. Marcos Huerta analyzed data on full moons and home runs to debunk each statement.
I had assumed that some Google marketing types asked some MLB data team members8 for some lunar factoids and some poor analyst when probably knew better sent them whatever they could find: error bars be damned.
But maybe they really did use Gemini. The ad included 3 stats that are all a little true – if you ignore the error bars, and the home run stat in particular has some enormous error bars. That feels like what might happen if you ask an LLM to do data analysis without babysitting it carefully. Agentic p-hacking? Yet, not really p-hacking since it still couldn’t find a statistically significant result.
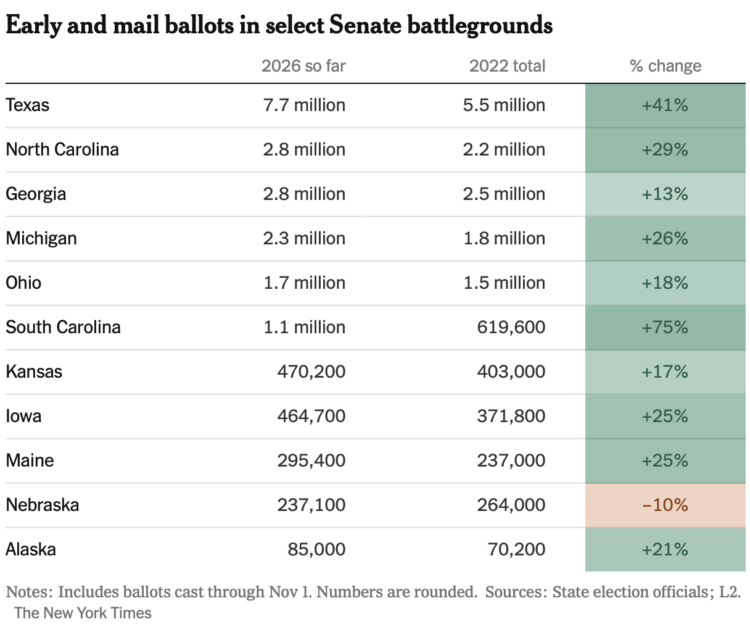
Evan Reynolds and Christine Zhang, for the New York Times, have quick tabulations for early midterm voting. Turnout is up by a lot compared to the last midterm election.
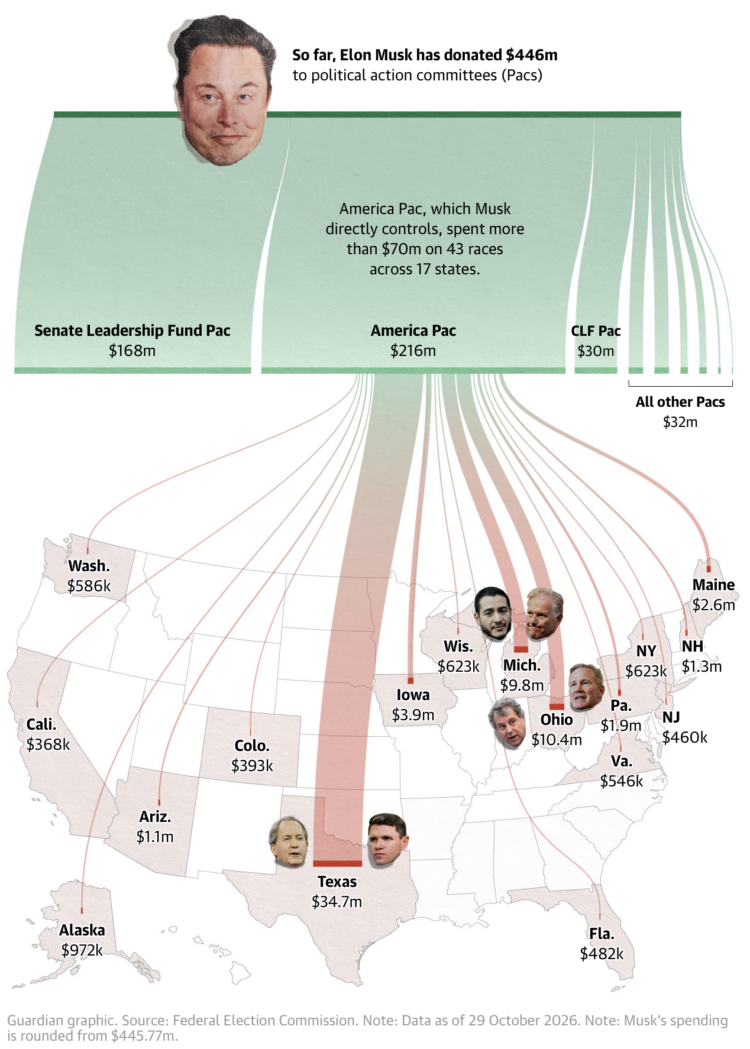
Elon Musk has donated $446 million for the midterm elections, because sure why not. The Guardian used a Sankey diagram that flows onto a state map to show where the money goes.
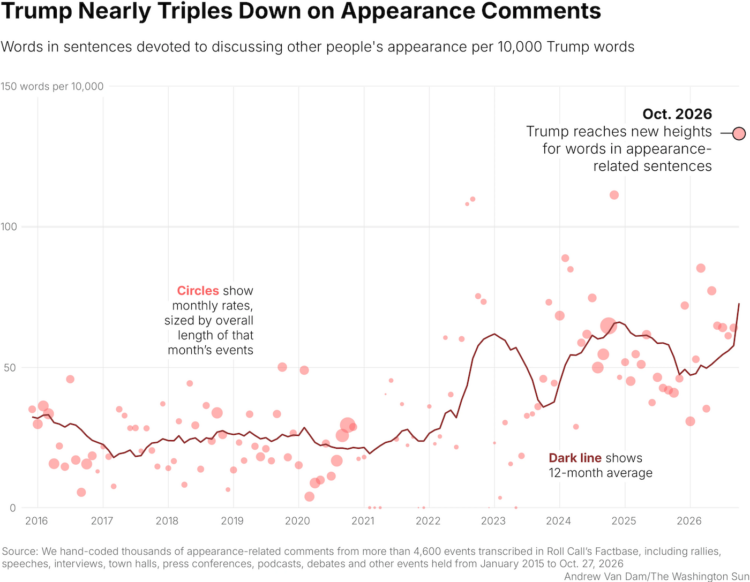
For the Washington Sun, Andrew Van Dam and Manuela Silva note the uptick in Trump comments about butts and bodies.
Trump has long had a penchant for complimenting — or disparaging — the physical appearances of his allies and enemies alike. But a new analysis by The Washington Sun shows that Trump has referenced physical appearance almost three times as much in the past year as he did during the same period in the 2016 campaign.
The president of the United States, ladies and gentlemen.
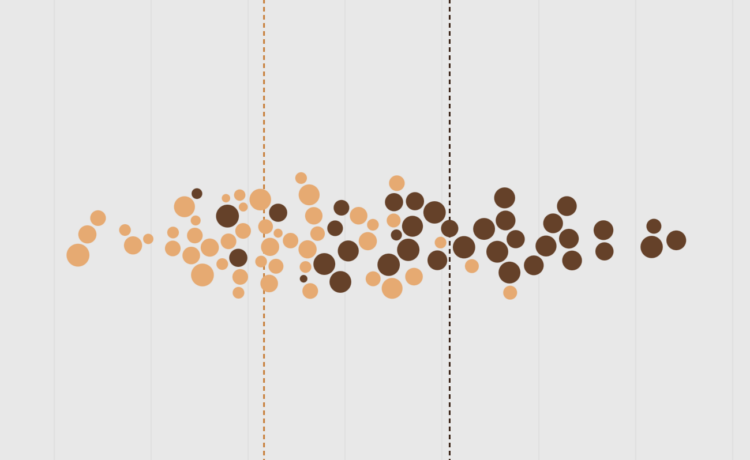
After a night of trick-or-treating, the candy gets dumped on the table and we take inventory of the sweet bounty. There are the favorites, and then there is the small pile on the side that no one likes. What usually lands in the throwaway pile?
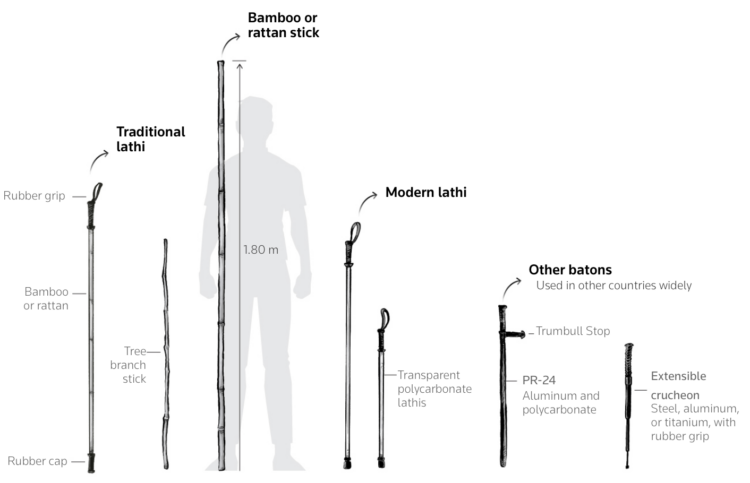
With more demonstrations and protests in India, Reuters charts and illustrates current tactics police use and the conflict with public safety.
Although Indian law constitutionally protects the right to assembly, a report authored by human rights lawyer Vrinda Grover for International Center for Not-for-Profit Law (ICNL) finds this protection often fails in practice.
Ultimately, the decision to intervene rests with executive magistrates or police.
A majority of surveyed officers believe they should be allowed to use force without fear of punishment, according to the Status of Policing in India Report 2025. Delhi Police and the Home Ministry did not immediately respond to Reuters request for comments.
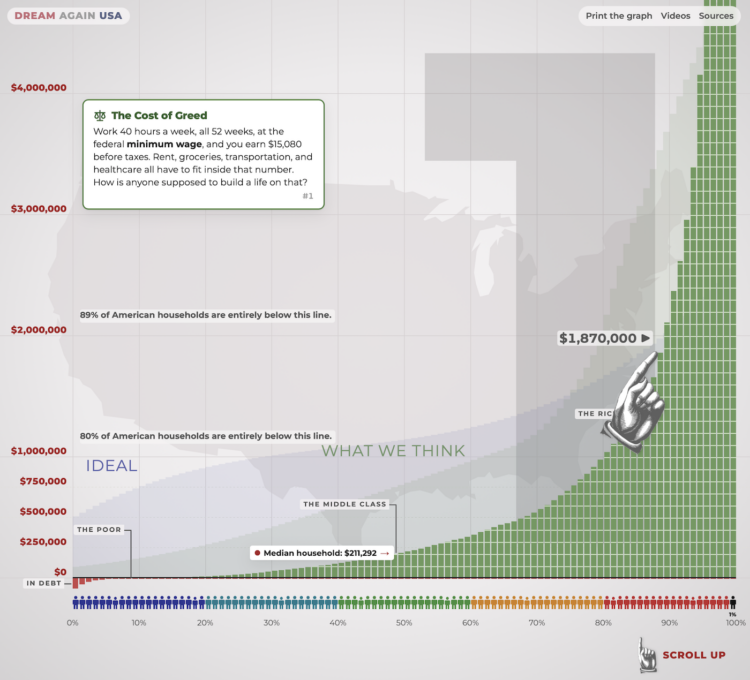
Last month, the Wealth Inequality in America video by Politizane got an update after thirteen years. The gap between the richest and the normals has only grown. This interactive version uses the very tall chart from the video to show the scale of wealth for the top 0.1% of people.
Set your expectations for how long it will take to scroll from the bottom to the top. Then reset expectations as it becomes clear that it’s annoyingly tall. Keep going. Reset again. Keep going, change the scale, reset. There is an “I quit!” button for a reason.
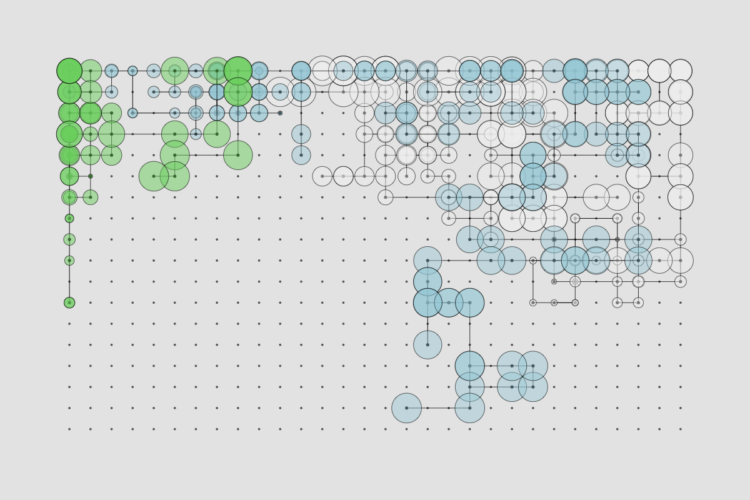
Every month, I gather tools and resources to make better charts that communicate and reveal. Here is what happened in October.
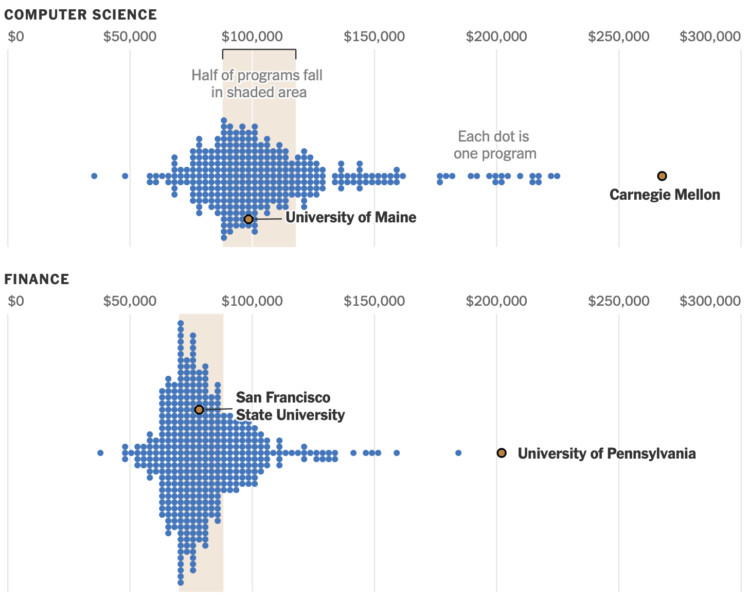
For the New York Times, Arfa Momin and Ron Lieber charted median income of graduates, by college and major.
Your school can make a big difference — or matter very little — depending on the major. A graduate who studied mechanical engineering at Carnegie Mellon University earned roughly $10,000 more than a graduate from the University of Alabama. That difference is over $150,000 if those same graduates studied computer science.
You can also search for your college and major to compare.
There are correlation and causation considerations to make here, but the data from the Department of Education exists to hold schools accountable. If a school charges a high tuition, but graduates earn lower incomes, then the program is worth a closer look.
The charts in the NYT article are based on an analysis by the HEA Group, who have made their data available for download. [Thanks, Charlotte]
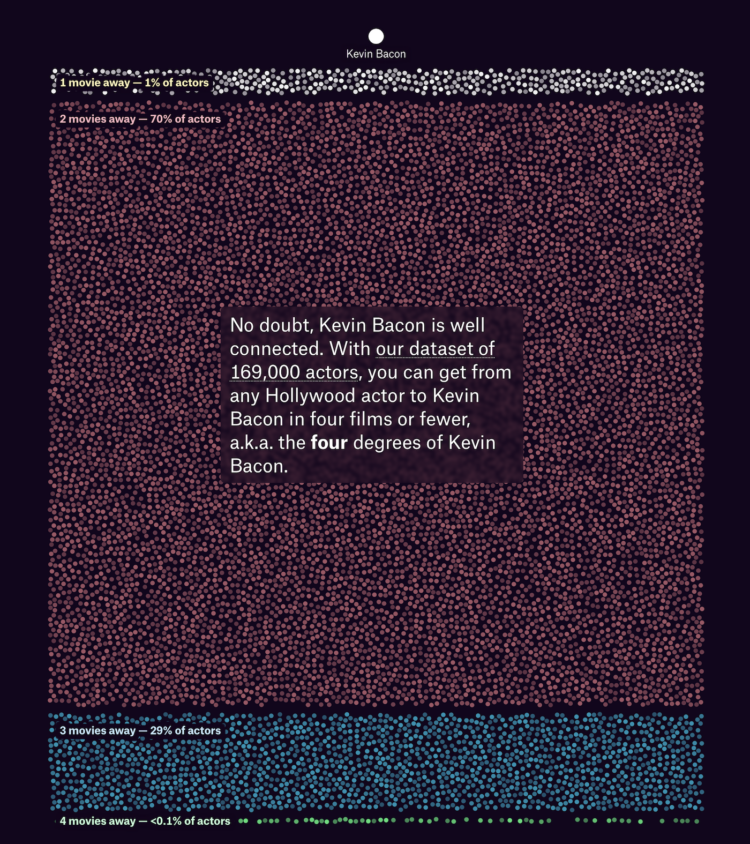
For the Pudding, Owen Lacey analyzed the network of Hollywood actors connected by movies they appeared together in. The goal is to find the “real” Kevin Bacon.
Lacey uses remoteness, or the average number of movies it takes for an actor to connect to all other actors in the network. Lower remoteness means a more connected actor. So to find the most connected, you find the actor with the lowest remoteness.
Kevin Bacon has a lot of acting credits, but there are many actors who are more connected.
The visual essay has a nice a structure that walks through past, present, and future with a well-made line chart.
I also appreciate the classic analysis on degrees of separation. It’s been a while. See also the six degrees of Francis Bacon, four degrees through Facebook, and the six degrees of Kevin Garnett (might be defunct).
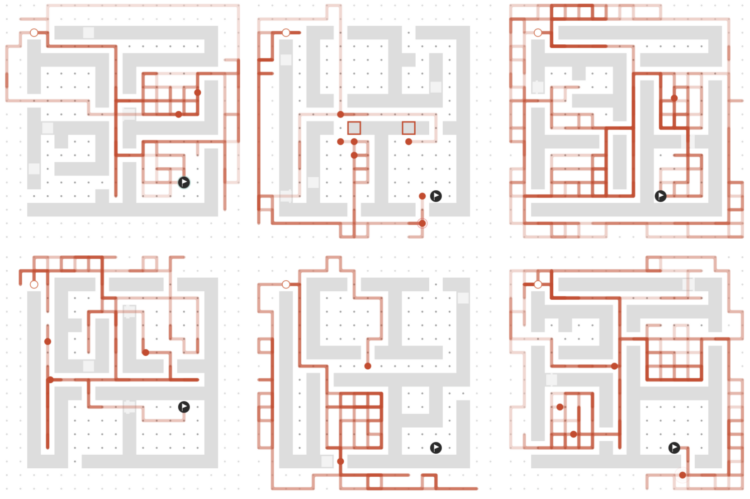
For the New York Times, Raj Saha and Blacki Migliozzi used mazes to demonstrate how AI models are trained and how agents complete tasks in unexpected ways. Some argue the double-edged sword:
At the same time, he said, agents can’t be safely contained if they are given the tools and access they need to be useful. “An inconvenient truth about developing frontier A.I. systems is that minimizing safety risks and maximizing legitimate utility are incompatible objectives,” Dr. Casper said. “The same agent that is good at helping biologists debug lab experiments could also be misused for constructing biohazards. In this sense, building ever more capable A.I. systems is somewhat of an inherently dangerous activity.”
Call me crazy, but if the large companies are held financially and socially liable for the models they distribute, I suspect the companies might find a way to block “rogue” behavior.
Ethics aside, the mazes in this piece are a good illustration of how the AI gets made. I paused at each one to watch the simulations play through.
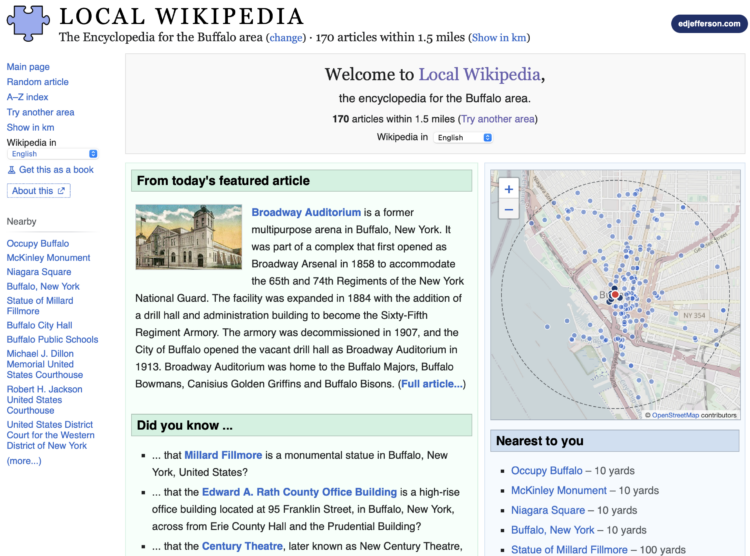
Local Wikipedia, by Ed Jefferson, subsets regular Wikipedia to people, places, and things that are within a half hour walk from you. Just enter a location and get the localness.
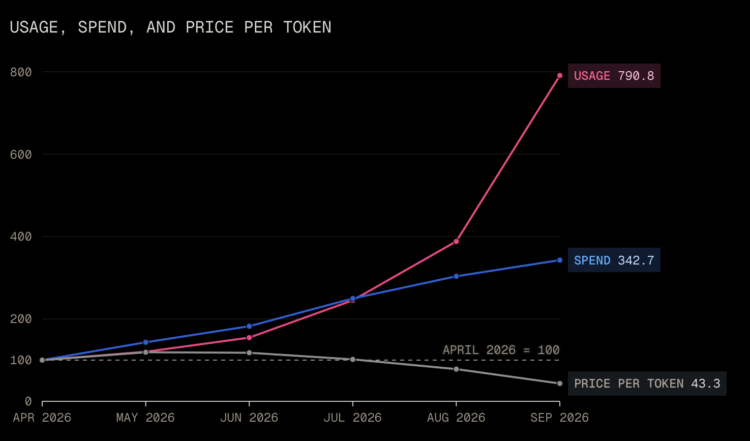
On a per token basis, the cost of using LLMs from Anthropic and OpenAI decreased a lot over just the past few months. Max Woolf lays out the fast timeline.
From the timeline above, there is a clear tit-for-tat between Anthropic and OpenAI, and it is reasonable to assume that these particular price cuts from OpenAI and Anthropic are in reaction to each other. However, no one cuts prices by 80% unless there is some externality in play. So, what gives?
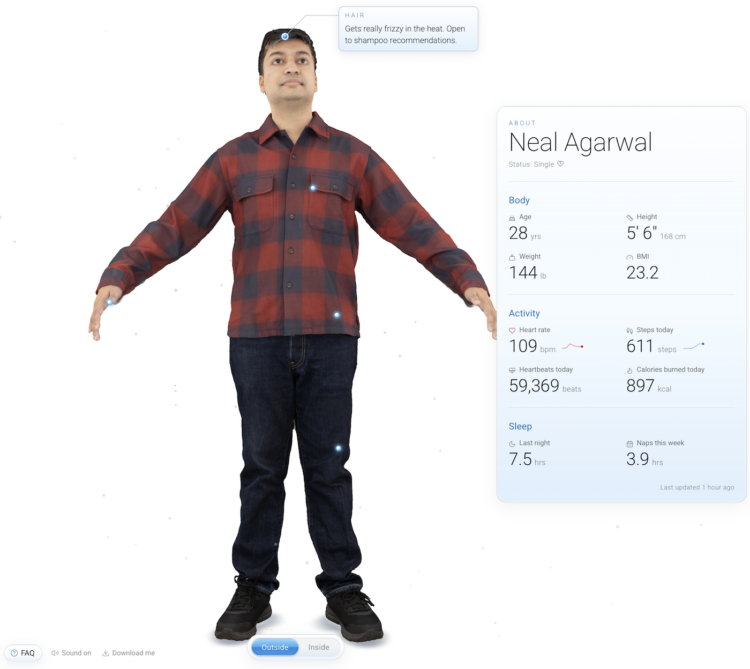
You know the about pages on every site that provide a summary of topics covered. Maybe there is a little bit about the writer. Neal Agarwal took the about page in a more literal direction. There is an interactive 3-D scan (that you can download) and live metrics from Agarwal’s fitness watch, so you know that he took 3.9 hours of naps this week and has type B+ blood.
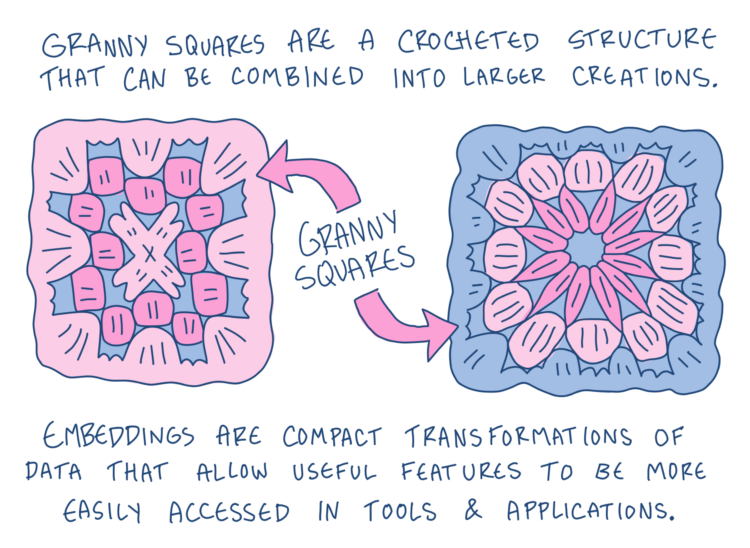
For Development Seed, Kiri Carini and Martha Morrissey explain what embeddings are and what they are used for.
An embedding represents this information as numbers grouped into dimensions of a “latent space.” We are used to describing our world with three spatial dimensions, but dimensions in latent space are mathematical rather than physical. Together, they encode patterns and relationships the model has learned from the data.
As humans living in a three-dimensional world, it’s hard to imagine a space with dozens, hundreds, or even thousands of dimensions. This makes embeddings difficult for humans to interpret directly, but computers have no problem working with these mathematical representations. In practice, an embedding is usually stored as a list of numbers.
Illustrations by Gus Becker provide a crochet metaphor to help you mentally link the steps. While in the context of geospatial data, the guide should also be helpful in understanding embeddings in general.
Terence Tao has become the unofficial spokesperson for the future of mathematics. Elisabeth Bumiller, for the New York Times, reports on the soured relationship between Tao and OpenAI:
OpenAI’s releases have now left him feeling used. “As recently as a year ago, I had a pretty good relationship with many employees at OpenAI,” he said in a recent phone conversation.
“A lot of people I interacted with shared a very common vision of how A.I. should be used — you know, to empower scientists.” But the rush to publish new findings, he said, shows their true purpose. They “used math for what they needed, which was to evaluate their models,” he said. “At this point, I don’t see a way to constructively engage.”
I feel for the PhD students who are four years into research and OpenAI comes along. I think the only successful path forward involves figuring out how these new tools intertwine with existing work.
Mathematician and Cornell professor Steven Strogatz was a guest on NYT’s Daily podcast to talk about the recent developments in Mathematics. Well, it starts out that way, and then Strogatz gets into purpose and touches on deeper feelings that many of us are getting to know.
 Visualize This: The FlowingData Guide to Design, Visualization, and Statistics (2nd Edition)
New tools, refined process.