For Quanta Magazine, Shalma Wegsman provides a history of Jean-Baptiste Joseph Fourier’s transform. James Cooley and John Tukey get a nod:
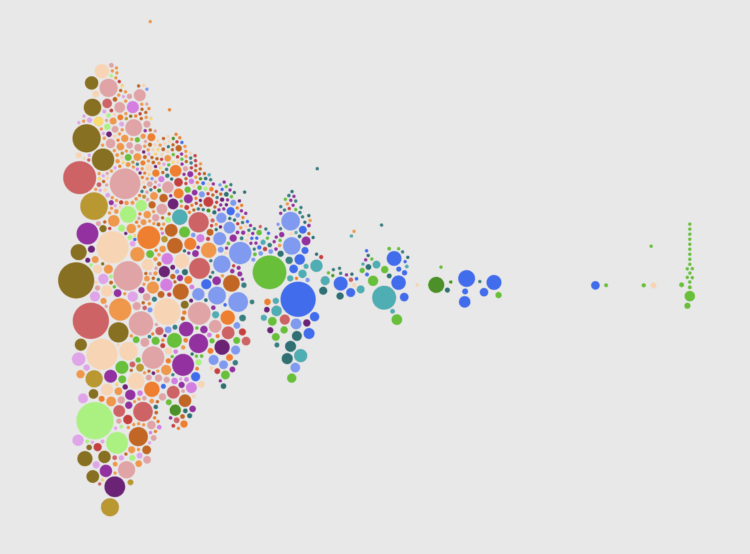
Any 8-by-8 image, for example, can be built from some combination of the 64 building blocks [above]. A compression algorithm can then remove high-frequency information, which corresponds to small details, without drastically changing how the image looks to the human eye. This is how JPEGs compress complex images into much smaller amounts of data.
In the 1960s, the mathematicians James Cooley and John Tukey came up with an algorithm that could perform a Fourier transform much more quickly — aptly called the fast Fourier transform. Since then, the Fourier transform has been implemented practically every time there is a signal to process. “It’s now a part of everyday life,” Greengard said.
I’ve said this before, but this would’ve been useful for me in college. The two-hour lectures on Fourier transforms, after lunch and in the dark, were brutal and I might’ve missed a slide or twenty.
 Visualize This: The FlowingData Guide to Design, Visualization, and Statistics (2nd Edition)


