In NBA basketball, the home team used to almost always wear a white…
2024
-
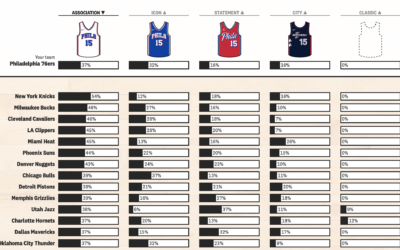
Uniform flair on the rise in NBA basketball games
-
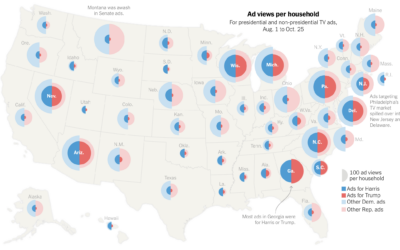
Election ad views for Democrats and Republicans
For NYT Opinion, Gus Wezerek compared ad views per household:
To figure out… -

Presidential Election Chances, Practice Run
See how different probabilities lead to different outcomes with an interactive chart.
-
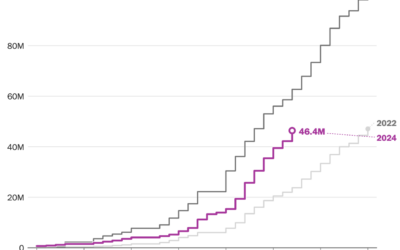
Early voting turnout
Early voting isn’t coming in as hot as in 2020, but there are…
-
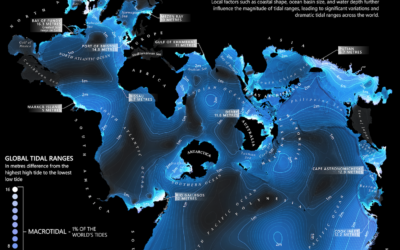
World map of tides
From Dave Taylor, this world map shows tidal ranges, from microtidal to macrotidal:…
-
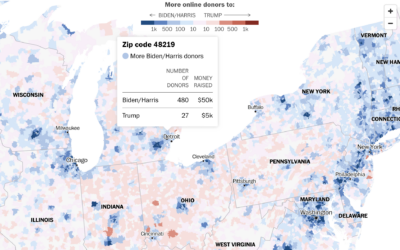
Which campaign people donate more to, by ZIP code
Using a combination of Federal Election Commission filings and voter registration, the Washington…
-
Members Only

Translating Visualization Steps
This week we imagine what we would do if the tool we relied on the most were to disappear.
-

Micro-communities that might decide the election
For NYT Opinion, Patrick Ruffini, with graphics by Quoctrung Bui and Aileen Clarke,…
-
Members Only
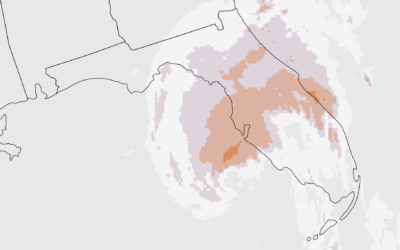
Make the Chart: Precipitation Map as Animated GIF
Weather. Data. Map. Animation. They go well together to show sudden changes over time.
-
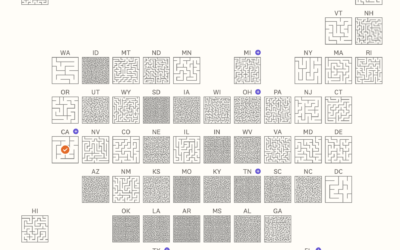
Abortion mazes to represent the complexity of abortion access
Speaking of grid maps and abortion access, Jan Diehm and Michelle Pera-McGhee, for…
-

Legality of abortion pills in each state
For the Washington Post, N. Kirkpatrick and Szu Yu Chen describe the legality…
-

Visual explainer for the thrilling game of Crokinole
From Russell Samora for The Pudding, “Crokinole is like a mashup of shuffleboard…
-
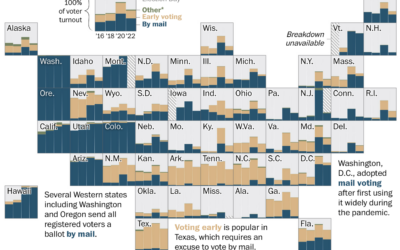
How Americans vote in each state
Some states have almost completely moved to voting by mail or early voting,…
-
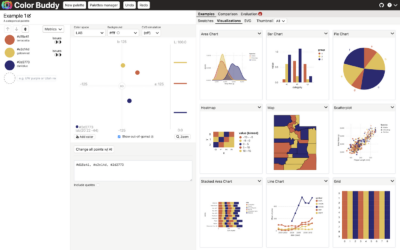
Color Buddy, a tool for building color palettes for visualization
Picking colors for visualization can be tricky, because there are infinite possibilities across…
-

Scale of buildings destroyed in Gaza
Damage assessments from UNOSAT estimate that 66% of structures in Gaza are damaged…
-
Members Only

Stats Are for Losers
This week, I heard that stats are for losers. I had to check it out, because I’ve always thought stats were for winners.
-
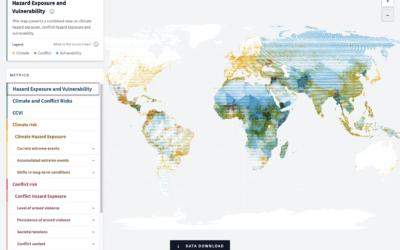
Scoring climate, conflict, and vulnerability around the world
In an effort to measure and highlight risks globally, the German Federal Foreign…
-

Hybrid and Electric Vehicle Adoption in the States
About 4% of registered light-duty vehicles in the United States are either electric,…
-
Members Only

Make the Chart: Grid Map with Stacked Areas
Breaking it down to the small steps and choices with data, code, and editing that lead to a finished chart.
-
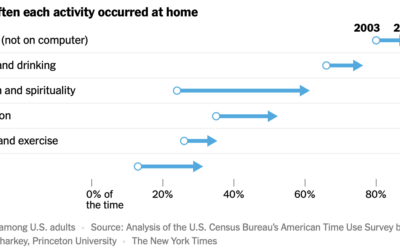
Increasing time spent at home
For NYT’s the Upshot, Ronda Kaysen and Alicia Parlapiano highlight analysis by Patrick…
Recently for Members
Second Edition
 Visualize This: The FlowingData Guide to Design, Visualization, and Statistics (2nd Edition)
 Visualize This: The FlowingData Guide to Design, Visualization, and Statistics (2nd Edition)
Browse by Chart Type See All →


