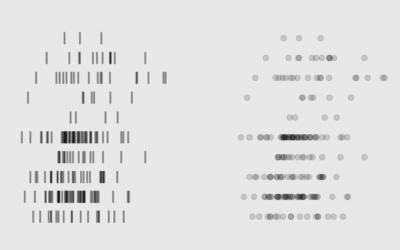
Statistician Kristian Lum described her experiences with harassment as a graduate student at…
2017
-
Harassment in the Statistics field
-
12 Days of ChaRt-mas
As everyone has already checked out for the rest of the year, I’m going to mess around with R to the tune of The Twelve Days of Christmas and nobody can stop me.
-
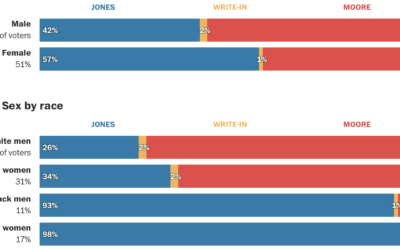
Alabama voter demographics
Democrat Doug Jones won in the senate race against Republican Roy More last…
-
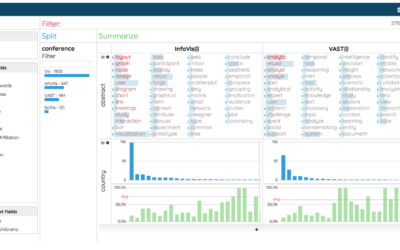
Data visualization for analysis and understanding complex problems
Enrico Bertini, a professor at New York University, delves into the less flashy…
-
Worries over the 2020 Census
Michael Wines, reporting for The New York Times:
“The politicization of the census… -
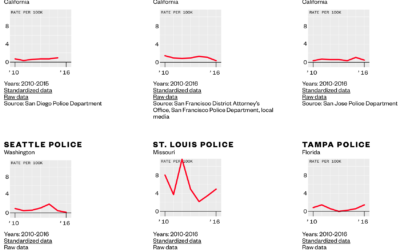
Download comprehensive police shootings data
Data for police shootings is usually the subset that only includes fatalities. Vice…
-
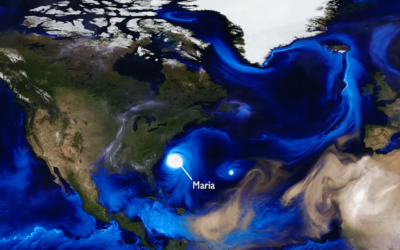
Simulation shows swirling of smoke, sea salt, and dust around the world
NASA. Data. Good.
Tracking the aerosols carried on the winds let scientists see… -
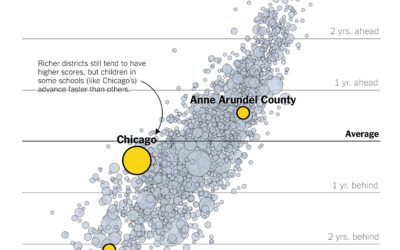
Where students learn the most
Emily Badger and Kevin Quealy, reporting for the Upshot, highlights research from Sean…
-
Members Only
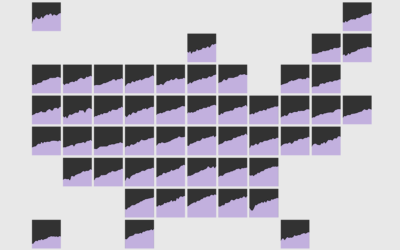
How to Make a State Map Grid with Small Multiples in R
Combining small multiples with the grid layout can make for an intuitive geographic reference.
-

How artificial intelligence can augment our own
There’s another essay on Distill by Shan Carter and Michael Nielsen. They describe…
-
Serial-Killer detector
Alec Wilkinson, reporting for The New Yorker, profiled Thomas Hargrove, who is deep…
-
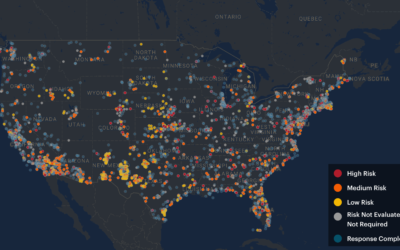
Bomb contaminants where you live
Lena Groeger, Ryann Grochowski Jones and Abrahm Lustgarten, reporting for ProPublica with a…
-
Link
2017 Chart Diary →
Adam Pearce, a New York Times graphics editor, provides the notes and thinking behind the charts he made during the year.
-

Microsoft Excel painter
Remember the artist Tatsuo Horiuchi who uses Microsoft Excel to paint scenery? Four…
-
Flawed hate crime data collection
Data can provide you with important information, but when the collection process is…
-
Members Only
Compact Ways to Visualize Distributions in R
For when you want to show or compare several distributions but don’t have a lot of space.
-

High-detail landscape using lidar data
Lidar, which is like radar but with lasers instead of radio waves, can…
-
Drawing with noise
This looks like a fun Processing tutorial by Etienne Jacob. Use noise to…
-
800 pages of Tinder data
Judith Duportail, writing for the Guardian, requested her personal data from dating service…
-
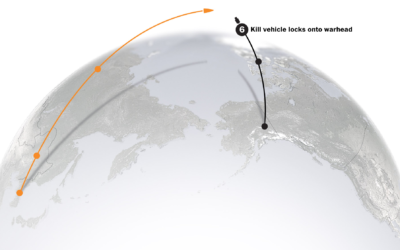
Stopping a nuclear missile fired at the US
I hate that this feels like something civilians should know. Bonnie Berkowitz and…
Recently for Members
Second Edition
 Visualize This: The FlowingData Guide to Design, Visualization, and Statistics (2nd Edition)
 Visualize This: The FlowingData Guide to Design, Visualization, and Statistics (2nd Edition)
New tools, refined process.
Browse by Chart Type See All →


