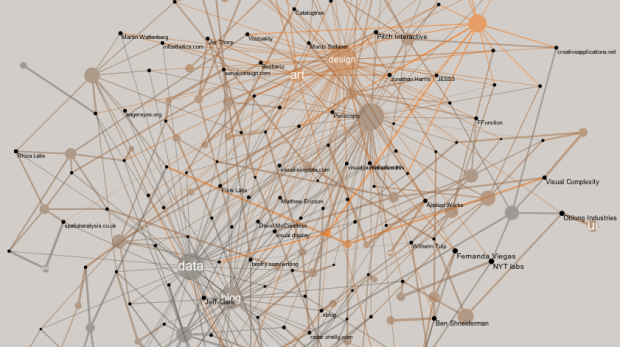
Developer Santiago Ortiz explores visualization references through Delicious tags and puts them in a discovery context. There are two views. The first is a network with tags and resources as nodes. At first it looks like a giant hairball, but mouseover and you get a fisheye effect to zoom in on nodes, which makes them more readable. Mouse over a tag, and the labels for related resources get bigger, and likewise, mouse over a resource, and the related tags get bigger.
The second view lets you compare resources. In the network, select two ore more resources, and then click on the bottom button to compare the selected.

The rings represent tags and are placed by popularity for each resource, so a ring on the outside is a more frequently used tag than the smaller ones in the middle. Be sure to use your mouse wheel to zoom in on those lesser used tags. It’s kind of like heading down a vortex.
 Visualize This: The FlowingData Guide to Design, Visualization, and Statistics (2nd Edition)
When I see all those network visualizations I don;t understand what kind of questions and swearers they produce. People draw a bunch of nodes connect them and hope to see some logic.